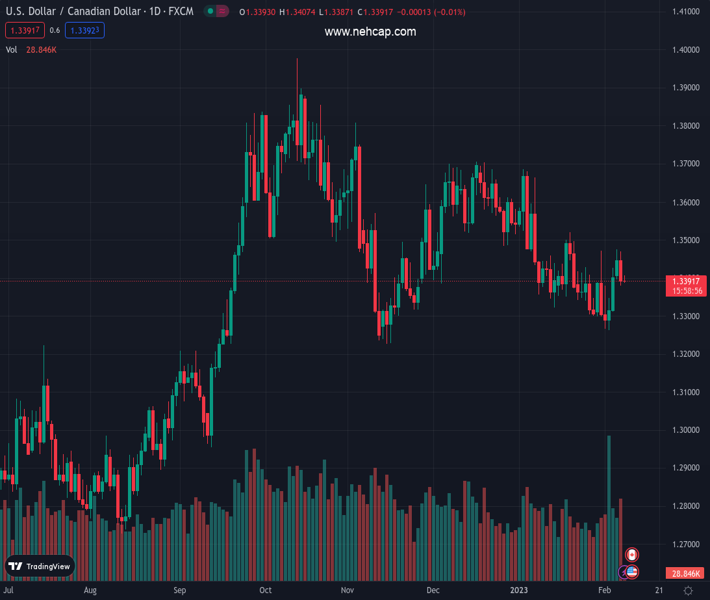
#USDCAD @ 1.33937 holds lower ground while defending the previous day’s reversal from 13-day high. (Pivot Orderbook analysis)
…
This is a premium post.
[s2If !current_user_can(access_s2member_level4)]Please register for PREMIUM VERSION HERE to read full post below containing analysis. In case of any error or you think you are not able to read the full post below, please email us at support#nehcap.com [lwa][/s2If] [s2If current_user_can(access_s2member_level4)]
- USD/CAD holds lower ground while defending the previous day’s reversal from 13-day high.
- US Dollar remains indecisive even as yields retreat, pays little heed to US President Biden’s SOTU amid mixed Fedspeak.
- BoC’s Macklem hints at a pause in rate hikes but failed to impress pair buyers.
- Risk catalysts could entertain Loonie traders ahead of Friday’s key jobs report from Canada.
The pair currently trades last at 1.33937.
The previous day high was 1.3469 while the previous day low was 1.338. The daily 38.2% Fib levels comes at 1.3414, expected to provide resistance. Similarly, the daily 61.8% fib level is at 1.3435, expected to provide resistance.
USD/CAD makes rounds to 1.3400 as bulls and bears jostle during early Wednesday morning in Europe. In doing so, the Loonie pair fails to justify dovish comments from Bank of Canada (BoC) Governor Tiff Macklem, as well as the mildly offered Oil price. Even so, the US Dollar’s failure to rebound enables the quote to remain mildly offered by the press time.
BoC Governor Macklem teases a pause in the rate hike trajectory by asking for time to gauge how households and businesses adapt to higher rates before further moves. The policymaker also said, “Rate hikes have hit homeowners hard.”
On the other hand, Federal Reserve Chairman Jerome Powell said, “Expect 2023 to be a year of significant declines in inflation,” while also adding that if data were to continue to come in stronger than expected, would certainly raise rates more. It’s worth observing that Fed’s Powell showed hesitance in praising the latest jump in the US Nonfarm Payrolls (NFP) during the appearance on Tuesday when asked about the job growth being a likely force behind the Fed’s aggressive rate hikes. The same suggests a pause in the Fed rate after currently priced-in two rate hikes worth 0.25%.
Elsewhere, US President Biden delivered his State of the Union (SOTU) speech in the first joint session of Congress since Republicans took control of the House of Representatives in January. During the SOTU, US President Biden showed readiness to work with them for the betterment of America. The policymaker also pushed for the billionaire minimum tax while trying to show a tough stand on China if the dragon nation undermines the US sovereignty.
Furthermore, WTI crude oil snaps a two-day rebound near $77.50 amid dicey markets and mixed concerns surrounding future energy demand. In doing so, the black gold fails to cheer a surprise draw in the private inventory data per the American Petroleum Institute’s (API) Weekly Crude Oil Stock data.
Against this backdrop, the US Dollar Index (DXY) remains sluggish near 103.30, after reversing from a one-month high the previous day. In doing so, the greenback’s gauge versus the six major currencies traces softer US Treasury bond yields while justifying unimpressive comments from US President Joe Biden and Federal Reserve (Fed) officials.
It’s worth noting that the S&P 500 Futures print mild losses near 4,170 while paring the biggest daily jump in nearly a week whereas the US 10-year Treasury bond yields snap a three-day uptrend while retreating from a one-month high of around 3.68% to 3.65% by the press time.
Moving ahead, a light calendar keeps challenging USD/CAD moves ahead of the key Canada monthly employment report, up for publishing on Friday.
Multiple failures to provide a daily closing beyond the 50-bar Exponential Moving Average (EMA), around 1.3445 by the press time, directs USD/CAD toward the 200-day EMA support of 1.3265.
Technical Levels: Supports and Resistances
USDCAD currently trading at 1.3397 at the time of writing. Pair opened at 1.3404 and is trading with a change of -0.05% % .
| Overview | Overview.1 | |
|---|---|---|
| 0 | Today last price | 1.3397 |
| 1 | Today Daily Change | -0.0007 |
| 2 | Today Daily Change % | -0.05% |
| 3 | Today daily open | 1.3404 |
The pair is trading above its 20 Daily moving average @ 1.3382, below its 50 Daily moving average @ 1.3494 , below its 100 Daily moving average @ 1.3536 and above its 200 Daily moving average @ 1.3227
| Trends | Trends.1 | |
|---|---|---|
| 0 | Daily SMA20 | 1.3382 |
| 1 | Daily SMA50 | 1.3494 |
| 2 | Daily SMA100 | 1.3536 |
| 3 | Daily SMA200 | 1.3227 |
The previous day high was 1.3469 while the previous day low was 1.338. The daily 38.2% Fib levels comes at 1.3414, expected to provide resistance. Similarly, the daily 61.8% fib level is at 1.3435, expected to provide resistance.
Note the levels of interest below:
- Pivot support is noted at 1.3366, 1.3328, 1.3277
- Pivot resistance is noted at 1.3455, 1.3507, 1.3544
| Levels | Levels.1 |
|---|---|
| Previous Daily High | 1.3469 |
| Previous Daily Low | 1.3380 |
| Previous Weekly High | 1.3472 |
| Previous Weekly Low | 1.3262 |
| Previous Monthly High | 1.3685 |
| Previous Monthly Low | 1.3300 |
| Daily Fibonacci 38.2% | 1.3414 |
| Daily Fibonacci 61.8% | 1.3435 |
| Daily Pivot Point S1 | 1.3366 |
| Daily Pivot Point S2 | 1.3328 |
| Daily Pivot Point S3 | 1.3277 |
| Daily Pivot Point R1 | 1.3455 |
| Daily Pivot Point R2 | 1.3507 |
| Daily Pivot Point R3 | 1.3544 |
[/s2If]
Join Our Telegram Group
")


