The index struggles to extend the upside and returns to the low-103.00s. (Pivot Orderbook analysis)
…
This is a premium post.
[s2If !current_user_can(access_s2member_level4)]Please register for PREMIUM VERSION HERE to read full post below containing analysis. In case of any error or you think you are not able to read the full post below, please email us at support#nehcap.com [lwa][/s2If] [s2If current_user_can(access_s2member_level4)]
- The index struggles to extend the upside and returns to the low-103.00s.
- Bullish attempts should meet the next hurdle around 104.00.
The pair currently trades last at 103.27.
The previous day high was 103.96 while the previous day low was 103.0. The daily 38.2% Fib levels comes at 103.37, expected to provide resistance. Similarly, the daily 61.8% fib level is at 103.59, expected to provide resistance.
DXY loses some momentum and adds to the rejection from Tuesday’s monthly highs just ahead of the 104.00 hurdle.
While above the 3-month support line near 102.00, further gains look likely, although the index needs to clear the February high at 103.96 (February 7) to allow for the continuation of the uptrend to the 2023 top at 105.63 (January 6).
In the longer run, while below the 200-day SMA at 106.45, the outlook for the index remains negative.
Technical Levels: Supports and Resistances
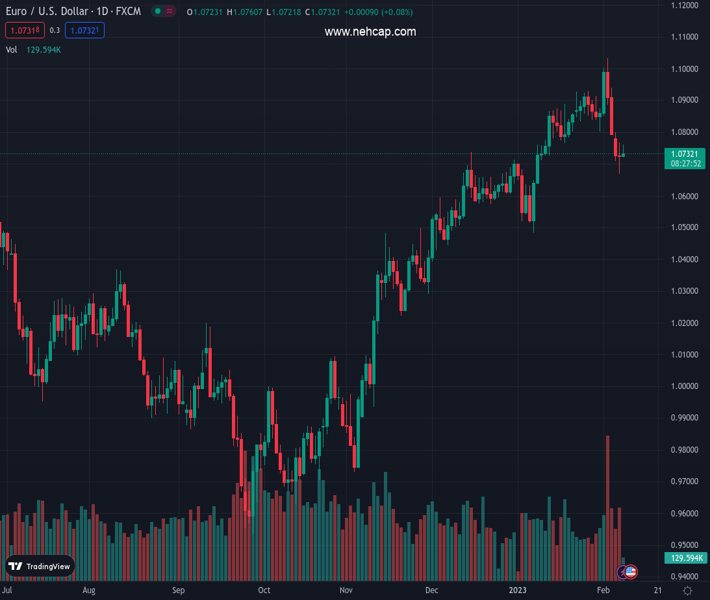
EURUSD currently trading at 103.27 at the time of writing. Pair opened at 103.36 and is trading with a change of -0.09 % .
| Overview | Overview.1 | |
|---|---|---|
| 0 | Today last price | 103.27 |
| 1 | Today Daily Change | 41.00 |
| 2 | Today Daily Change % | -0.09 |
| 3 | Today daily open | 103.36 |
The pair is trading above its 20 Daily moving average @ 102.27, below its 50 Daily moving average @ 103.56 , below its 100 Daily moving average @ 106.36 and below its 200 Daily moving average @ 106.7
| Trends | Trends.1 | |
|---|---|---|
| 0 | Daily SMA20 | 102.27 |
| 1 | Daily SMA50 | 103.56 |
| 2 | Daily SMA100 | 106.36 |
| 3 | Daily SMA200 | 106.70 |
The previous day high was 103.96 while the previous day low was 103.0. The daily 38.2% Fib levels comes at 103.37, expected to provide resistance. Similarly, the daily 61.8% fib level is at 103.59, expected to provide resistance.
Note the levels of interest below:
- Pivot support is noted at 102.92, 102.47, 101.95
- Pivot resistance is noted at 103.88, 104.41, 104.85
| Levels | Levels.1 |
|---|---|
| Previous Daily High | 103.96 |
| Previous Daily Low | 103.00 |
| Previous Weekly High | 103.01 |
| Previous Weekly Low | 100.81 |
| Previous Monthly High | 105.63 |
| Previous Monthly Low | 101.50 |
| Daily Fibonacci 38.2% | 103.37 |
| Daily Fibonacci 61.8% | 103.59 |
| Daily Pivot Point S1 | 102.92 |
| Daily Pivot Point S2 | 102.47 |
| Daily Pivot Point S3 | 101.95 |
| Daily Pivot Point R1 | 103.88 |
| Daily Pivot Point R2 | 104.41 |
| Daily Pivot Point R3 | 104.85 |
[/s2If]
Join Our Telegram Group
")


