#NZDJPY @ 82.8920 is subdued as the Asian session begins, following the formation of a doji, portraying indecision amongst traders. (Pivot Orderbook analysis)
…
This is a premium post.
[s2If !current_user_can(access_s2member_level4)]Please register for PREMIUM VERSION HERE to read full post below containing analysis. In case of any error or you think you are not able to read the full post below, please email us at support#nehcap.com [lwa][/s2If] [s2If current_user_can(access_s2member_level4)]
- NZD/JPY is subdued as the Asian session begins, following the formation of a doji, portraying indecision amongst traders.
- Bearish pennant in the NZD/JPY 1-hour chart warrants downward pressure lying ahead.
The pair currently trades last at 82.8920.
The previous day high was 83.88 while the previous day low was 82.62. The daily 38.2% Fib levels comes at 83.1, expected to provide resistance. Similarly, the daily 61.8% fib level is at 83.4, expected to provide resistance.
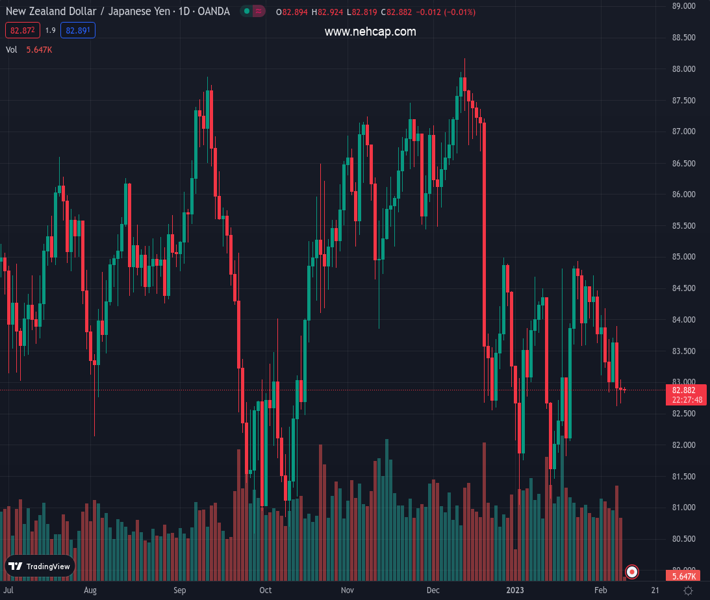
NZD/JPY failed to gain traction upward/downwards on Wednesday’s session, and meanders at around this week’s lows, as Thursday’s Asian Pacific session begins. At the time of writing, the NZD/JPY exchanges hands at 82.87, almost flat.
The NZD/JPY daily chart portrays the cross-currency pair as neutral to slightly downward biased, though it failed to gain traction on Wednesday. A doji surfaced nearby the low of the week of 82.65, which could exacerbate a consolidation in the near term. If that scenario plays out, the NZD/JPY will trade within the 82.65-83.00 for the remainder of the session unless a catalyst triggers the NZD/JPY to break above/below the range.
Upwards, the NZD/JPY first resistance would be the 20-day Exponential Moving Average (EMA) at 83.44, ahead of the 200-day EMA at 83.85. On the downside, the NZD/JPY’s next support would be the lows of the week at 82.65, followed by the psychological 82.00 mark
In the short term, the NZD/JPY1-hour chart portrays the formation of a bearish-pennant, which suggests downward action lies ahead. A break below the pennant bottom-trendline will pave the way for further losses and, on its first leg-down, would slide toward the S1 daily pivot at 82.62.
The NZD/JPY downtrend’s next stop would be the S2 pivot at 82.44, ahead of the S3 daily pivot at 82.24.
Technical Levels: Supports and Resistances
NZDJPY currently trading at 82.83 at the time of writing. Pair opened at 82.84 and is trading with a change of -0.01 % .
| Overview | Overview.1 | |
|---|---|---|
| 0 | Today last price | 82.83 |
| 1 | Today Daily Change | -0.01 |
| 2 | Today Daily Change % | -0.01 |
| 3 | Today daily open | 82.84 |
The pair remains strongly bearish on the daily time frame. It trades below the 20 SMA @ 83.45, 50 SMA 84.47, 100 SMA @ 84.53 and 200 SMA @ 84.54.
| Trends | Trends.1 | |
|---|---|---|
| 0 | Daily SMA20 | 83.45 |
| 1 | Daily SMA50 | 84.47 |
| 2 | Daily SMA100 | 84.53 |
| 3 | Daily SMA200 | 84.54 |
The previous day high was 83.88 while the previous day low was 82.62. The daily 38.2% Fib levels comes at 83.1, expected to provide resistance. Similarly, the daily 61.8% fib level is at 83.4, expected to provide resistance.
Note the levels of interest below:
- Pivot support is noted at 82.34, 81.84, 81.07
- Pivot resistance is noted at 83.61, 84.38, 84.88
| Levels | Levels.1 |
|---|---|
| Previous Daily High | 83.88 |
| Previous Daily Low | 82.62 |
| Previous Weekly High | 84.70 |
| Previous Weekly Low | 82.78 |
| Previous Monthly High | 84.93 |
| Previous Monthly Low | 81.04 |
| Daily Fibonacci 38.2% | 83.10 |
| Daily Fibonacci 61.8% | 83.40 |
| Daily Pivot Point S1 | 82.34 |
| Daily Pivot Point S2 | 81.84 |
| Daily Pivot Point S3 | 81.07 |
| Daily Pivot Point R1 | 83.61 |
| Daily Pivot Point R2 | 84.38 |
| Daily Pivot Point R3 | 84.88 |
[/s2If]
Join Our Telegram Group
")


