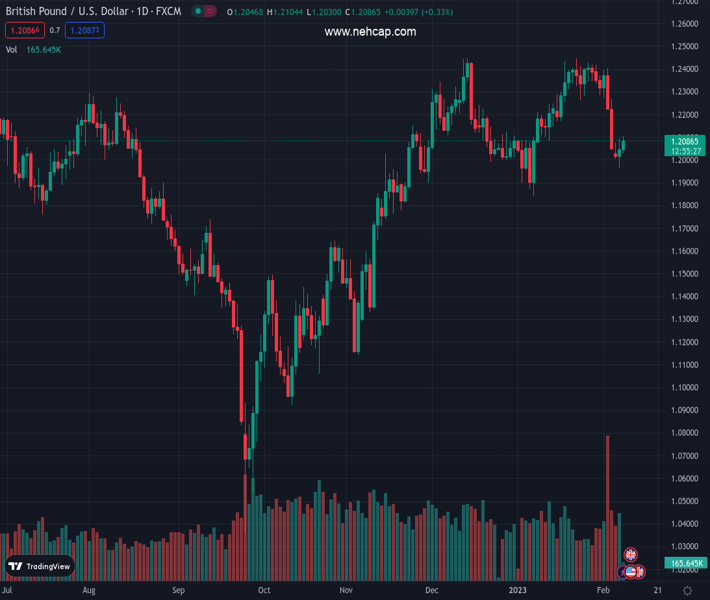
#GBPUSD @ 1.20881 gains traction for the second straight day and recovers further from over a one-month low. (Pivot Orderbook analysis)
…
This is a premium post.
[s2If !current_user_can(access_s2member_level4)]Please register for PREMIUM VERSION HERE to read full post below containing analysis. In case of any error or you think you are not able to read the full post below, please email us at support#nehcap.com [lwa][/s2If] [s2If current_user_can(access_s2member_level4)]
- GBP/USD gains traction for the second straight day and recovers further from over a one-month low.
- The less hawkish signs by Fed’s Powell, sliding US bond yields undermine the USD and lend support.
- Expectations that the BoE is nearing the end of its current rate-hiking cycle cap gains for the Sterling.
The pair currently trades last at 1.20881.
The previous day high was 1.2096 while the previous day low was 1.1961. The daily 38.2% Fib levels comes at 1.2044, expected to provide support. Similarly, the daily 61.8% fib level is at 1.2013, expected to provide support.
The GBP/USD pair builds on the overnight bounce from the vicinity of the 200-day SMA support and gains some follow-through traction for the second straight day on Wednesday. Spot prices climb to a fresh weekly high during the early part of the European session, with bulls now looking to extend the momentum further beyond the 1.2100 round-figure mark.
The US Dollar comes under some renewed selling pressure amid a modest downtick in the US Treasury bond yields and turns out to be a key factor acting as a tailwind for the GBP/USD pair. Fed Chair Jerome Powell failed to offer fresh hawkish signals on Tuesday and reiterated that the process of disinflation was underway. This, in turn, raises hopes that interest rates may not rise much further, which, in turn, exerts some downward pressure on the US bond yields and undermines the greenback.
That said, a generally weaker risk tone helps limit losses for the safe-haven buck and keeps a lid on any further upside for the GBP/USD pair, at least for the time being. The market sentiment remains fragile amid worries about economic headwinds stemming from the continuous rise in borrowing costs, the latest COVID-19 outbreak in China and the protracted Russia-Ukraine war. Apart from this, fears about worsening US-China relations temper investors’ appetite for perceived riskier assets.
Apart from this, a dovish assessment of the Bank of England (BoE) decision last week also contributes to capping the GBP/USD pair. In fact, the UK central bank removed the phrase that they would “respond forcefully, as necessary”. Furthermore, BoE Governor Andrew Bailey said that inflation will fall more rapidly during the second half of 2023. This raises speculations that the current rate-hiking cycle might be nearing the end and might hold back bulls from placing aggressive bets.
There isn’t any major market-moving economic data due for release on Wednesday, either from the UK or the US, leaving the GBP/USD pair at the mercy of the USD price dynamics. Hence, traders now look forward to speeches by influential FOMC members. This, along with the US bond yields and the broader risk sentiment, should drive the USD demand and provide some impetus to the GBP/USD pair. The focus will then shift to the BoE’s Monetary Policy Report Hearings on Thursday.
Technical Levels: Supports and Resistances
GBPUSD currently trading at 1.2094 at the time of writing. Pair opened at 1.204 and is trading with a change of 0.45 % .
| Overview | Overview.1 | |
|---|---|---|
| 0 | Today last price | 1.2094 |
| 1 | Today Daily Change | 0.0054 |
| 2 | Today Daily Change % | 0.4500 |
| 3 | Today daily open | 1.2040 |
The pair is trading below its 20 Daily moving average @ 1.2275, below its 50 Daily moving average @ 1.2193 , above its 100 Daily moving average @ 1.1816 and above its 200 Daily moving average @ 1.1951
| Trends | Trends.1 | |
|---|---|---|
| 0 | Daily SMA20 | 1.2275 |
| 1 | Daily SMA50 | 1.2193 |
| 2 | Daily SMA100 | 1.1816 |
| 3 | Daily SMA200 | 1.1951 |
The previous day high was 1.2096 while the previous day low was 1.1961. The daily 38.2% Fib levels comes at 1.2044, expected to provide support. Similarly, the daily 61.8% fib level is at 1.2013, expected to provide support.
Note the levels of interest below:
- Pivot support is noted at 1.1969, 1.1898, 1.1834
- Pivot resistance is noted at 1.2103, 1.2167, 1.2238
| Levels | Levels.1 |
|---|---|
| Previous Daily High | 1.2096 |
| Previous Daily Low | 1.1961 |
| Previous Weekly High | 1.2418 |
| Previous Weekly Low | 1.2050 |
| Previous Monthly High | 1.2448 |
| Previous Monthly Low | 1.1841 |
| Daily Fibonacci 38.2% | 1.2044 |
| Daily Fibonacci 61.8% | 1.2013 |
| Daily Pivot Point S1 | 1.1969 |
| Daily Pivot Point S2 | 1.1898 |
| Daily Pivot Point S3 | 1.1834 |
| Daily Pivot Point R1 | 1.2103 |
| Daily Pivot Point R2 | 1.2167 |
| Daily Pivot Point R3 | 1.2238 |
[/s2If]
Join Our Telegram Group
")


