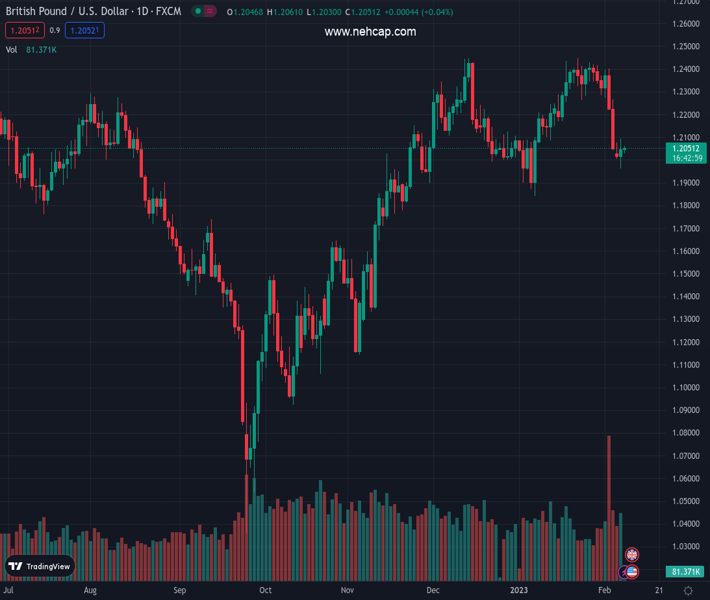
#GBPUSD @ 1.20502 struggles to extend the previous day’s rebound from one-month low, sidelined of late., @nehcap view: Limited upside expected (Pivot Orderbook analysis)
…
This is a premium post.
[s2If !current_user_can(access_s2member_level4)]Please register for PREMIUM VERSION HERE to read full post below containing analysis. In case of any error or you think you are not able to read the full post below, please email us at support#nehcap.com [lwa][/s2If] [s2If current_user_can(access_s2member_level4)]
- GBP/USD struggles to extend the previous day’s rebound from one-month low, sidelined of late.
- Oscillators suggest further recovery but death cross on the EMAs and 61.8% Fibonacci retracement level probe bulls.
- Five-week-old horizontal support area offers extra filters to the south.
The pair currently trades last at 1.20502.
The previous day high was 1.2096 while the previous day low was 1.1961. The daily 38.2% Fib levels comes at 1.2044, expected to provide support. Similarly, the daily 61.8% fib level is at 1.2013, expected to provide support.
GBP/USD fades the previous day’s rebound from a monthly low around 1.2050 heading into Wednesday’s London open. In doing so, the Cable pair justifies the bearish moving average crossover on the four-hour chart below the key Fibonacci retracement level.
That said, the 50-bar Exponential Moving Average (EMA) crosses the 200-bar EMA from above, which in turn portrays the “Death cross” and suggests further downside of the GBP/USD pair. Also challenging the quote is the 61.8% Fibonacci retracement level of January 06-23 upside, near 1.2080.
It should be observed, however, that the gradual rise in the RSI (14) and the recently firmer MACD signals keep buyers hopeful.
As a result, the GBP/USD pair’s run-up beyond the immediate 1.2080 can’t be ruled out. In that case, the 50% Fibonacci retracement and the 200-EMA, respectively near 1.2150 and 1.2200, will be important to watch.
Should the pair remains firmer past 1.2200, it can again try to cross the 1.2445-50 horizontal hurdle.
On the flip side, the 1.2000 psychological magnet precedes the latest swing low near 1.1960 to limit the short-term GBP/USD downside.
Following that, a horizontal area comprising multiple levels marked since January 03 and the previous monthly low, close to 1.1930 and 1.1840 in that order, should lure the pair sellers.
Trend: Limited upside expected
Technical Levels: Supports and Resistances
GBPUSD currently trading at 1.2052 at the time of writing. Pair opened at 1.204 and is trading with a change of 0.10% % .
| Overview | Overview.1 | |
|---|---|---|
| 0 | Today last price | 1.2052 |
| 1 | Today Daily Change | 0.0012 |
| 2 | Today Daily Change % | 0.10% |
| 3 | Today daily open | 1.204 |
The pair is trading below its 20 Daily moving average @ 1.2275, below its 50 Daily moving average @ 1.2193 , above its 100 Daily moving average @ 1.1816 and above its 200 Daily moving average @ 1.1951
| Trends | Trends.1 | |
|---|---|---|
| 0 | Daily SMA20 | 1.2275 |
| 1 | Daily SMA50 | 1.2193 |
| 2 | Daily SMA100 | 1.1816 |
| 3 | Daily SMA200 | 1.1951 |
The previous day high was 1.2096 while the previous day low was 1.1961. The daily 38.2% Fib levels comes at 1.2044, expected to provide support. Similarly, the daily 61.8% fib level is at 1.2013, expected to provide support.
Note the levels of interest below:
- Pivot support is noted at 1.1969, 1.1898, 1.1834
- Pivot resistance is noted at 1.2103, 1.2167, 1.2238
| Levels | Levels.1 |
|---|---|
| Previous Daily High | 1.2096 |
| Previous Daily Low | 1.1961 |
| Previous Weekly High | 1.2418 |
| Previous Weekly Low | 1.2050 |
| Previous Monthly High | 1.2448 |
| Previous Monthly Low | 1.1841 |
| Daily Fibonacci 38.2% | 1.2044 |
| Daily Fibonacci 61.8% | 1.2013 |
| Daily Pivot Point S1 | 1.1969 |
| Daily Pivot Point S2 | 1.1898 |
| Daily Pivot Point S3 | 1.1834 |
| Daily Pivot Point R1 | 1.2103 |
| Daily Pivot Point R2 | 1.2167 |
| Daily Pivot Point R3 | 1.2238 |
[/s2If]
Join Our Telegram Group
")


