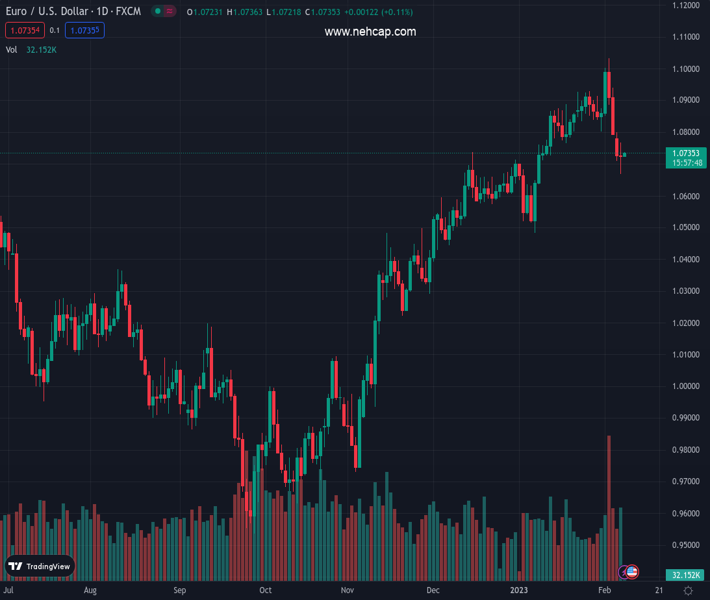
#EURUSD @ 1.07341 is displaying a sideways auction ahead of the German Inflation data. (Pivot Orderbook analysis)
…
This is a premium post.
[s2If !current_user_can(access_s2member_level4)]Please register for PREMIUM VERSION HERE to read full post below containing analysis. In case of any error or you think you are not able to read the full post below, please email us at support#nehcap.com [lwa][/s2If] [s2If current_user_can(access_s2member_level4)]
- EUR/USD is displaying a sideways auction ahead of the German Inflation data.
- The major currency pair is popping between the 50% and 61.8% Fibo retracement.
- A range shift move by the RSI (14) into the 40.00-60.00 zone from the bearish range indicates signs of a bullish reversal.
The pair currently trades last at 1.07341.
The previous day high was 1.0767 while the previous day low was 1.0669. The daily 38.2% Fib levels comes at 1.0706, expected to provide support. Similarly, the daily 61.8% fib level is at 1.0729, expected to provide support.
The EUR/USD pair is oscillating in an extremely narrow range around 1.0730 as investors are awaiting the release of the preliminary German inflation data for fresh impetus. The commentary from US President Joe Biden over the current altercation with China while addressing the State of the Union (SOTU) has failed to impact the risk appetite of the market participants.
The US Dollar Index (DXY) is displaying a sideways performance below 103.00, weighed down by US Treasury yields. The yields generated by 10-year US government bonds have dropped below 3.65%.
On the Eurozone front, the preliminary German Harmonized Index of Consumer Prices (HICP) (Jan) is expected to escalate to 10.0% from the former release of 9.6%.
EUR/USD has turned sideways after a wild movement post commentary from Federal Reserve (Fed) chair Jerome Powell on interest rate guidance. The major currency pair is expected to witness a sheer contraction in volatility ahead, which will result in wider ticks and heavy volume after an expansion in the same.
The shared currency pair is oscillating between the 50% and 61.8% Fibonacci retracements (placed from January 6 low at 1.0483 to February 1 high at 1.1033) at 1.0760 and 1.0694 respectively.
The 20-period Exponential Moving Average (EMA) at 1.0739 is acting as a major barricade for the Euro.
However, the Relative Strength Index (RSI) (14) has shifted into the 40.00-60.00 range from the bearish range of 20.00-40.00, which indicates signs of a bullish reversal.
Going forward, a break above Tuesday’s high at 1.0766 will drive the asset toward the round-level resistance at 1.0800 followed by 38.2% Fibo retracement at 1.0823.
On the flip side, a break below Tuesday’s low at 1.0669 will drag the major currency pair toward January 4 high at 1.0635 and December 22 low at 1.0573.
Technical Levels: Supports and Resistances
EURUSD currently trading at 1.0729 at the time of writing. Pair opened at 1.0725 and is trading with a change of 0.04 % .
| Overview | Overview.1 | |
|---|---|---|
| 0 | Today last price | 1.0729 |
| 1 | Today Daily Change | 0.0004 |
| 2 | Today Daily Change % | 0.0400 |
| 3 | Today daily open | 1.0725 |
The pair is trading below its 20 Daily moving average @ 1.0841, above its 50 Daily moving average @ 1.0693 , above its 100 Daily moving average @ 1.0335 and above its 200 Daily moving average @ 1.0321
| Trends | Trends.1 | |
|---|---|---|
| 0 | Daily SMA20 | 1.0841 |
| 1 | Daily SMA50 | 1.0693 |
| 2 | Daily SMA100 | 1.0335 |
| 3 | Daily SMA200 | 1.0321 |
The previous day high was 1.0767 while the previous day low was 1.0669. The daily 38.2% Fib levels comes at 1.0706, expected to provide support. Similarly, the daily 61.8% fib level is at 1.0729, expected to provide support.
Note the levels of interest below:
- Pivot support is noted at 1.0674, 1.0623, 1.0577
- Pivot resistance is noted at 1.0771, 1.0818, 1.0869
| Levels | Levels.1 |
|---|---|
| Previous Daily High | 1.0767 |
| Previous Daily Low | 1.0669 |
| Previous Weekly High | 1.1033 |
| Previous Weekly Low | 1.0793 |
| Previous Monthly High | 1.0930 |
| Previous Monthly Low | 1.0483 |
| Daily Fibonacci 38.2% | 1.0706 |
| Daily Fibonacci 61.8% | 1.0729 |
| Daily Pivot Point S1 | 1.0674 |
| Daily Pivot Point S2 | 1.0623 |
| Daily Pivot Point S3 | 1.0577 |
| Daily Pivot Point R1 | 1.0771 |
| Daily Pivot Point R2 | 1.0818 |
| Daily Pivot Point R3 | 1.0869 |
[/s2If]
Join Our Telegram Group
")


