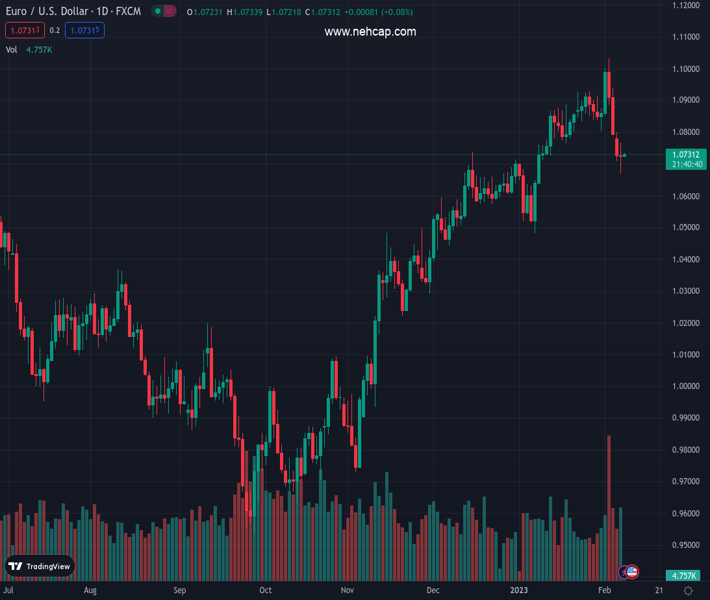
#EURUSD @ 1.07311 grinds near monthly low after posting a bullish candlestick on daily formation., @nehcap view: Further recovery expected (Pivot Orderbook analysis)
…
This is a premium post.
[s2If !current_user_can(access_s2member_level4)]Please register for PREMIUM VERSION HERE to read full post below containing analysis. In case of any error or you think you are not able to read the full post below, please email us at support#nehcap.com [lwa][/s2If] [s2If current_user_can(access_s2member_level4)]
- EUR/USD grinds near monthly low after posting a bullish candlestick on daily formation.
- Bullish moving average crossover, steady RSI adds strength to the upside bias.
- Three-month-old previous support line holds the key to Euro bull’s conviction.
The pair currently trades last at 1.07311.
The previous day high was 1.0767 while the previous day low was 1.0669. The daily 38.2% Fib levels comes at 1.0706, expected to provide support. Similarly, the daily 61.8% fib level is at 1.0729, expected to provide support.
EUR/USD stays defensive near 1.0730 during inactive early trading hours of Wednesday, following a bounce off monthly low to post the bullish Doji candlestick on Tuesday. In doing so, the major currency pair justifies the steady RSI (14) while also keeping the previous day’s bounce off the 50-DMA support.
It should be noted that the 100-DMA pierced the 200-DMA from below and portrayed a “Golden cross” during the last week, which in turn back the latest upside bias.
However, the recovery remains elusive unless the EUR/USD pair stays below the previous support line from early November 2022, around 1.0860.
Following that, a run-up towards refreshing the monthly peak, currently near 1.1035, can’t be ruled out. Though, the 1.0900 and the 1.1000 round figures may act as intermediate halts during the expected rally.
Meanwhile, a daily closing beneath the 50-DMA, around 1.0700 by the press time, could reject the bullish bias while sustained trading below the previous day’s low of 1.0669 will defy the upbeat signals sent via the Doji candlestick.
In that case, a downward trajectory toward the previous monthly low of 1.0483 can’t be ruled out.
However, the 100-DMA and the 200-DMA, respectively around 1.0345 and 1.0320, could challenge the EUR/USD bears afterward.
Trend: Further recovery expected
Technical Levels: Supports and Resistances
EURUSD currently trading at 1.0728 at the time of writing. Pair opened at 1.0725 and is trading with a change of 0.03% % .
| Overview | Overview.1 | |
|---|---|---|
| 0 | Today last price | 1.0728 |
| 1 | Today Daily Change | 0.0003 |
| 2 | Today Daily Change % | 0.03% |
| 3 | Today daily open | 1.0725 |
The pair is trading below its 20 Daily moving average @ 1.0841, above its 50 Daily moving average @ 1.0693 , above its 100 Daily moving average @ 1.0335 and above its 200 Daily moving average @ 1.0321
| Trends | Trends.1 | |
|---|---|---|
| 0 | Daily SMA20 | 1.0841 |
| 1 | Daily SMA50 | 1.0693 |
| 2 | Daily SMA100 | 1.0335 |
| 3 | Daily SMA200 | 1.0321 |
The previous day high was 1.0767 while the previous day low was 1.0669. The daily 38.2% Fib levels comes at 1.0706, expected to provide support. Similarly, the daily 61.8% fib level is at 1.0729, expected to provide support.
Note the levels of interest below:
- Pivot support is noted at 1.0674, 1.0623, 1.0577
- Pivot resistance is noted at 1.0771, 1.0818, 1.0869
| Levels | Levels.1 |
|---|---|
| Previous Daily High | 1.0767 |
| Previous Daily Low | 1.0669 |
| Previous Weekly High | 1.1033 |
| Previous Weekly Low | 1.0793 |
| Previous Monthly High | 1.0930 |
| Previous Monthly Low | 1.0483 |
| Daily Fibonacci 38.2% | 1.0706 |
| Daily Fibonacci 61.8% | 1.0729 |
| Daily Pivot Point S1 | 1.0674 |
| Daily Pivot Point S2 | 1.0623 |
| Daily Pivot Point S3 | 1.0577 |
| Daily Pivot Point R1 | 1.0771 |
| Daily Pivot Point R2 | 1.0818 |
| Daily Pivot Point R3 | 1.0869 |
[/s2If]
Join Our Telegram Group
")


