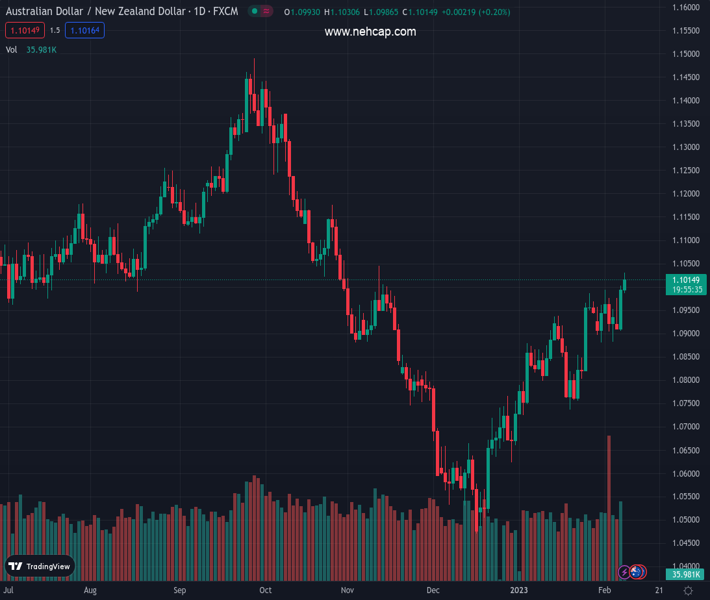
#AUDNZD @ 1.10134 has printed an intraday high of 1.1020 amid hawkish RBA bets. (Pivot Orderbook analysis)
…
This is a premium post.
[s2If !current_user_can(access_s2member_level4)]Please register for PREMIUM VERSION HERE to read full post below containing analysis. In case of any error or you think you are not able to read the full post below, please email us at support#nehcap.com [lwa][/s2If] [s2If current_user_can(access_s2member_level4)]
- AUD/NZD has printed an intraday high of 1.1020 amid hawkish RBA bets.
- A breakout of the Symmetrical Triangle has pushed the cross above the 50% Fibo retracement.
- The RSI (14) has climbed above 60.00, which adds to the upside filters.
The pair currently trades last at 1.10134.
The previous day high was 1.1 while the previous day low was 1.0906. The daily 38.2% Fib levels comes at 1.0964, expected to provide support. Similarly, the daily 61.8% fib level is at 1.0942, expected to provide support.
The AUD/NZD pair has printed an intraday high of 1.1020 on expectations that the Reserve Bank of Australia (RBA) will continue its policy-tightening spell ahead. RBA Governor Philip Lowe will continue hiking interest rates further amid the absence of inflation peak signs in the Australian economy.
The RBA announced a fourth consecutive 25 bps interest rate hike on Tuesday to 3.35%. While addressing the nation, RBA Governor was very confident that Australian Consumer Price Index (CPI) might decline to 4.75% this year and to around 3% by mid-2025, however, further monetary policy contraction cannot be ruled out.
AUD/NZD has delivered a breakout of the Symmetrical Triangle chart pattern formed on an eight-hour scale, which indicates an expansion in volatility and results in wider ticks and heavy volume. A breakout of the aforementioned chart pattern has pushed the cross above the 50% Fibonacci retracement (placed from September 28 high at 1.1490 to December 16 low at 1.0471) at 1.0984.
The upward-sloping trendline from December 16 low at 1.0471 will continue to act as a major support for the Australian Dollar. Also, the asset has scaled above the 20-period Exponential Moving Average (EMA) at 1.0953, which indicates that the short-term trend is bullish.
The Relative Strength Index (RSI) (14) has scaled into the bullish range of 60.00-80.00, which indicates more upside ahead.
Should the cross breaks above November 11 high at 1.1045, Australian bulls will drive the cross toward the 61.8% Fibo retracement placed around 1.1100 followed by October 26 high around 1.1176.
On the contrary, a break below January 31 low at 1.0881 will drag the cross toward January 10 low around 1.0800. A slippage below the latter will extend the downside toward January 19 low at 1.0737.
Technical Levels: Supports and Resistances
AUDNZD currently trading at 1.1024 at the time of writing. Pair opened at 1.0998 and is trading with a change of 0.24 % .
| Overview | Overview.1 | |
|---|---|---|
| 0 | Today last price | 1.1024 |
| 1 | Today Daily Change | 0.0026 |
| 2 | Today Daily Change % | 0.2400 |
| 3 | Today daily open | 1.0998 |
The pair remains strongly bullish on the daily timeframe. It trades above its 20 SMA @ 1.0898, 50 SMA 1.0763, 100 SMA @ 1.0925 and 200 SMA @ 1.1005.
| Trends | Trends.1 | |
|---|---|---|
| 0 | Daily SMA20 | 1.0898 |
| 1 | Daily SMA50 | 1.0763 |
| 2 | Daily SMA100 | 1.0925 |
| 3 | Daily SMA200 | 1.1005 |
The previous day high was 1.1 while the previous day low was 1.0906. The daily 38.2% Fib levels comes at 1.0964, expected to provide support. Similarly, the daily 61.8% fib level is at 1.0942, expected to provide support.
Note the levels of interest below:
- Pivot support is noted at 1.0937, 1.0875, 1.0844
- Pivot resistance is noted at 1.103, 1.1061, 1.1123
| Levels | Levels.1 |
|---|---|
| Previous Daily High | 1.1000 |
| Previous Daily Low | 1.0906 |
| Previous Weekly High | 1.0994 |
| Previous Weekly Low | 1.0881 |
| Previous Monthly High | 1.0986 |
| Previous Monthly Low | 1.0726 |
| Daily Fibonacci 38.2% | 1.0964 |
| Daily Fibonacci 61.8% | 1.0942 |
| Daily Pivot Point S1 | 1.0937 |
| Daily Pivot Point S2 | 1.0875 |
| Daily Pivot Point S3 | 1.0844 |
| Daily Pivot Point R1 | 1.1030 |
| Daily Pivot Point R2 | 1.1061 |
| Daily Pivot Point R3 | 1.1123 |
[/s2If]
Join Our Telegram Group
")


