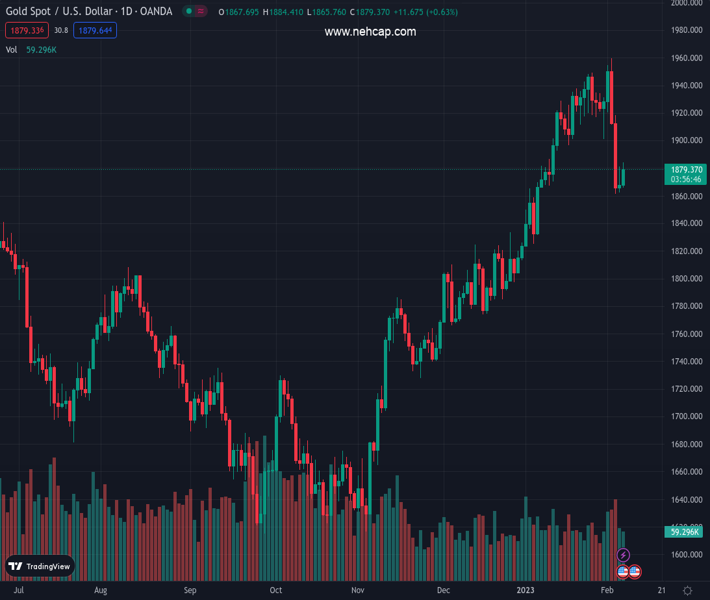
#XAUUSD @ 1,880.46 Gold remained steadily firm, around $1870 ahead of Powell’s speech. (Pivot Orderbook analysis)
…
This is a premium post.
[s2If !current_user_can(access_s2member_level4)]Please register for PREMIUM VERSION HERE to read full post below containing analysis. In case of any error or you think you are not able to read the full post below, please email us at support#nehcap.com [lwa][/s2If] [s2If current_user_can(access_s2member_level4)]
- Gold remained steadily firm, around $1870 ahead of Powell’s speech.
- US Federal Reserve officials expect rates to peak above 5%, with some estimating 5.4%.
- Gold Price Forecast: To remain neutral biased but slightly skewed to the downside.
The pair currently trades last at 1880.46.
The previous day high was 1881.39 while the previous day low was 1860.3. The daily 38.2% Fib levels comes at 1873.33, expected to provide support. Similarly, the daily 61.8% fib level is at 1868.36, expected to provide support.
Gold price clings to gains on Tuesday, though it remains below Monday’s high of 1881.31, ahead of Fed’s Chair Jerome Powell’s comments in an event at the Economic Club of Washington at 17:40 GMT. Hence, the XAU/USD is exchanging hands at 1874.20 after hitting a daily low of 1865.81 at the time of writing.
Wall Street has turned positive, except for the Dow Jones Industrial. A late risk-on impulse at around the London Fix weighed on the US Dollar (USD), with Briton traders squaring their positions ahead of Powell’s speech. It’s the first time the Fed Chair takes the stand after an eye-opening US jobs report, with the economy adding more than 500,000 jobs and the unemployment rate diving to 53-year lows at 3.4%.
Comments from Federal Reserve officials spurred a reaction from market participants. Raphael Bostic, from the Atlanta Fed, commented that the Fed would need to raise rates further than previously foreseen. Echoing some of its comments was the Minnesota Fed President Neil Kashkari, a voter in 2023, that he anticipates the Federal Fund rate at around 5.4% due to the stronger-than-expected labor market report, which showed that the US central bank needs to keep raising rates.
The reflection of those comments is US bond yields. The 10-year benchmark note rate is 3.652%, up by two bps. After the US Nonfarm Payrolls report, the 10-year bond yield rallied 26 bps, as traders expect the Federal Funds rate to peak at around 5.25%. In addition, the US 10-year TIPS bond yield, a proxy for real yields, is advancing one bps, sitting at 1.369%, capping Gold’s rally on Tuesday.
The US economic docket will feature further Fed speaking, Initial Jobless Claims for the week ending on February 4, and the University of Michigan Consumer Sentiment.
XAU/USD remains neutral biased, trapped within the boundaries of the 20 and 50-day Exponential Moving Average (EMA) at the $1897-$1855 range. To resume its upward bias, Gold needs to break Monday’s high of $1882, which would exacerbate a test of the 20-day EMA, ahead of the $1900 mark. Otherwise, the XAU/USD will be under selling pressure, with the February 6 low at $1860.44, as the first demand area, followed by the 50-day EMA, ahead of December’s 27 daily high-turned-support at $1833.29
Technical Levels: Supports and Resistances
XAUUSD currently trading at 1873.85 at the time of writing. Pair opened at 1868.5 and is trading with a change of 0.29 % .
| Overview | Overview.1 | |
|---|---|---|
| 0 | Today last price | 1873.85 |
| 1 | Today Daily Change | 5.35 |
| 2 | Today Daily Change % | 0.29 |
| 3 | Today daily open | 1868.50 |
The pair is trading below its 20 Daily moving average @ 1914.22, above its 50 Daily moving average @ 1848.61 , above its 100 Daily moving average @ 1768.4 and above its 200 Daily moving average @ 1776.01
| Trends | Trends.1 | |
|---|---|---|
| 0 | Daily SMA20 | 1914.22 |
| 1 | Daily SMA50 | 1848.61 |
| 2 | Daily SMA100 | 1768.40 |
| 3 | Daily SMA200 | 1776.01 |
The previous day high was 1881.39 while the previous day low was 1860.3. The daily 38.2% Fib levels comes at 1873.33, expected to provide support. Similarly, the daily 61.8% fib level is at 1868.36, expected to provide support.
Note the levels of interest below:
- Pivot support is noted at 1858.74, 1848.97, 1837.65
- Pivot resistance is noted at 1879.83, 1891.15, 1900.92
| Levels | Levels.1 |
|---|---|
| Previous Daily High | 1881.39 |
| Previous Daily Low | 1860.30 |
| Previous Weekly High | 1959.80 |
| Previous Weekly Low | 1861.45 |
| Previous Monthly High | 1949.27 |
| Previous Monthly Low | 1823.76 |
| Daily Fibonacci 38.2% | 1873.33 |
| Daily Fibonacci 61.8% | 1868.36 |
| Daily Pivot Point S1 | 1858.74 |
| Daily Pivot Point S2 | 1848.97 |
| Daily Pivot Point S3 | 1837.65 |
| Daily Pivot Point R1 | 1879.83 |
| Daily Pivot Point R2 | 1891.15 |
| Daily Pivot Point R3 | 1900.92 |
[/s2If]
Join Our Telegram Group
")


