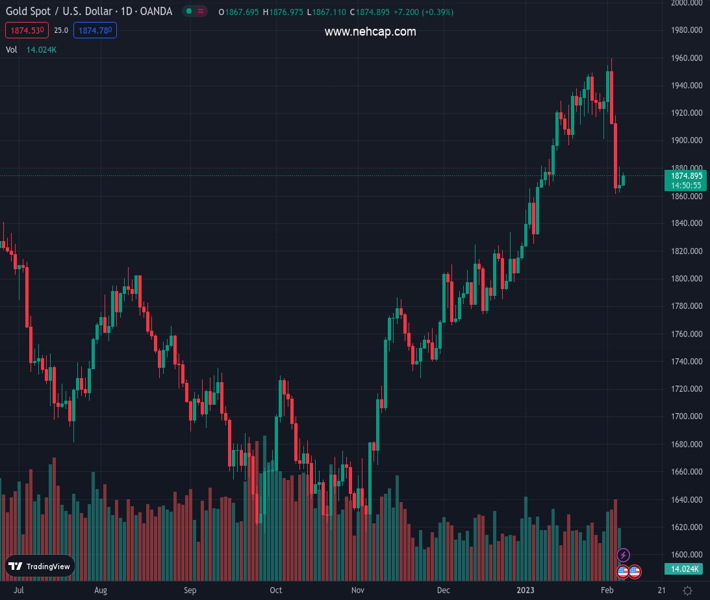
#XAUUSD @ 1,875.05 Gold price clings to mild gains while extending the week-start rebound from one-month low., @nehcap view: Limited recovery expected (Pivot Orderbook analysis)
…
This is a premium post.
[s2If !current_user_can(access_s2member_level4)]Please register for PREMIUM VERSION HERE to read full post below containing analysis. In case of any error or you think you are not able to read the full post below, please email us at support#nehcap.com [lwa][/s2If] [s2If current_user_can(access_s2member_level4)]
- Gold price clings to mild gains while extending the week-start rebound from one-month low.
- US Dollar bears the burden of market’s cautious optimism to propel XAU/USD rebound.
- Fed Chair Powell needs to praise recently strong US data to challenge Gold buyers.
- US President Biden’s SOTU, Sino-American headlines also eyed for immediate directions.
The pair currently trades last at 1875.05.
The previous day high was 1881.39 while the previous day low was 1860.3. The daily 38.2% Fib levels comes at 1873.33, expected to provide support. Similarly, the daily 61.8% fib level is at 1868.36, expected to provide support.
Gold price (XAU/USD) picks up bids to refresh intraday high near $1,876 while printing a two-day uptrend during early Tuesday.
In doing so, the bright metal extends the week-start rebound from a monthly low as the US Dollar weakness joins cautious optimism in the market to favor the XAU/USD bulls. However, anxiety ahead of the Federal Reserve Chairman Jerome Powell and US President Joe Biden’s State of the Union (SOTU) comments seem to challenge the metal buyers of late.
The mildly positive sentiment could be linked to the comments from US Treasury Secretary Janet Yellen and President Joe Biden which pushed back the US recession concerns. On the same line were the comments from US President Joe Bide which appear to placate the Sino-American fears by saying, “The balloon incident does not weaken US-China relations.”
Alternatively, hawkish Fed talks seem to put a floor under the US Treasury bond yields, as well as the US Dollar. “The strong labor market probably means ‘we have to do a little more work,’” said Federal Reserve Bank of Atlanta President Raphel Bostic in an interview with Bloomberg. It’s worth noting that the firmer US jobs report and activity data for January renewed hawkish Fed bias the last Friday but a lack of directives seem to probe the greenback bulls afterward.
Against this backdrop, S&P 500 Futures print mild gains but the US Treasury bond yields struggle to extend the two-day rebound from the monthly low. It should be observed that the US Dollar Index (DXY) also retreats from the one-month high, marked the previous day, amid sluggish markets.
Looking ahead, Gold traders should concentrate on Fed Chair Powell’s capacity praises the latest upbeat US data, as well as US President Biden’s SOTU.
Gold price rebounds from one-month-old horizontal support surrounding $1,865 backed by an improvement in the oversold RSI (14), as well as the looming bull cross on the MACD.
However, 200-Simple Moving Average (SMA) surrounding $1,880 guards the XAU/USD’s immediate upside.
Even if the Gold price stays firmer past $1,880, a three-week-long resistance area around the $1,900 round figure could act as the last defense of the sellers before directing the prices towards the resistance line from mid-January, close to $1,968 at the latest.
Meanwhile, a clear downside break of $1,865 isn’t an open welcome to the Gold bears as an upward-sloping support line from December 15, 2022, around $1,850, could challenge the metal’s further downside.
Trend: Limited recovery expected
Technical Levels: Supports and Resistances
XAUUSD currently trading at 1876.23 at the time of writing. Pair opened at 1868.5 and is trading with a change of 0.41% % .
| Overview | Overview.1 | |
|---|---|---|
| 0 | Today last price | 1876.23 |
| 1 | Today Daily Change | 7.73 |
| 2 | Today Daily Change % | 0.41% |
| 3 | Today daily open | 1868.5 |
The pair is trading below its 20 Daily moving average @ 1914.22, above its 50 Daily moving average @ 1848.61 , above its 100 Daily moving average @ 1768.4 and above its 200 Daily moving average @ 1776.01
| Trends | Trends.1 | |
|---|---|---|
| 0 | Daily SMA20 | 1914.22 |
| 1 | Daily SMA50 | 1848.61 |
| 2 | Daily SMA100 | 1768.40 |
| 3 | Daily SMA200 | 1776.01 |
The previous day high was 1881.39 while the previous day low was 1860.3. The daily 38.2% Fib levels comes at 1873.33, expected to provide support. Similarly, the daily 61.8% fib level is at 1868.36, expected to provide support.
Note the levels of interest below:
- Pivot support is noted at 1858.74, 1848.97, 1837.65
- Pivot resistance is noted at 1879.83, 1891.15, 1900.92
| Levels | Levels.1 |
|---|---|
| Previous Daily High | 1881.39 |
| Previous Daily Low | 1860.30 |
| Previous Weekly High | 1959.80 |
| Previous Weekly Low | 1861.45 |
| Previous Monthly High | 1949.27 |
| Previous Monthly Low | 1823.76 |
| Daily Fibonacci 38.2% | 1873.33 |
| Daily Fibonacci 61.8% | 1868.36 |
| Daily Pivot Point S1 | 1858.74 |
| Daily Pivot Point S2 | 1848.97 |
| Daily Pivot Point S3 | 1837.65 |
| Daily Pivot Point R1 | 1879.83 |
| Daily Pivot Point R2 | 1891.15 |
| Daily Pivot Point R3 | 1900.92 |
[/s2If]
Join Our Telegram Group
")


