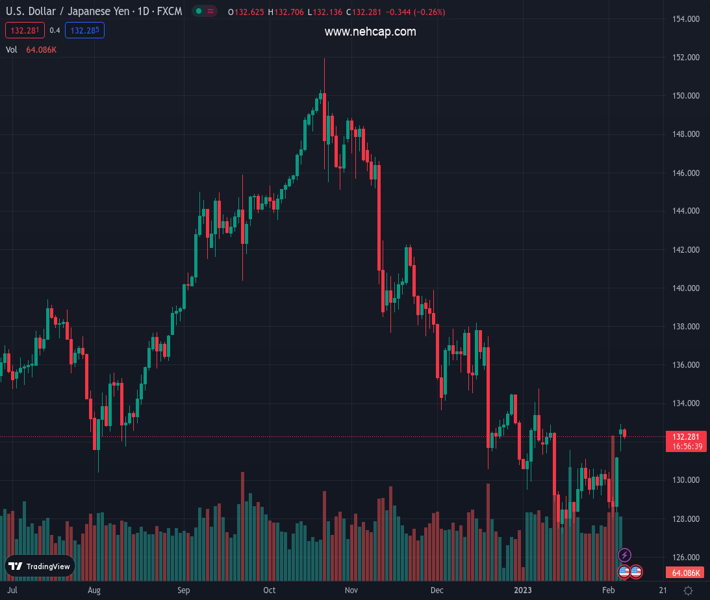
#USDJPY @ 132.263 retreats from one-month high to snap two-day uptrend., @nehcap view: Further upside expected (Pivot Orderbook analysis)
…
This is a premium post.
[s2If !current_user_can(access_s2member_level4)]Please register for PREMIUM VERSION HERE to read full post below containing analysis. In case of any error or you think you are not able to read the full post below, please email us at support#nehcap.com [lwa][/s2If] [s2If current_user_can(access_s2member_level4)]
- USD/JPY retreats from one-month high to snap two-day uptrend.
- RSI pullback from overbought territory favors the Yen pair’s U-turn.
- Bullish MACD signals, sustained trading beyond the previous key resistance, 200-SMA favor bulls.
The pair currently trades last at 132.263.
The previous day high was 132.91 while the previous day low was 131.18. The daily 38.2% Fib levels comes at 132.25, expected to provide support. Similarly, the daily 61.8% fib level is at 131.84, expected to provide support.
USD/JPY grinds near intraday low during the first loss-making day in three, mildly offered near 132.30 heading into Tuesday’s European session.
In doing so, the Yen pair takes clues from the RSI (14) to retreat from the 50% Fibonacci retracement level of the pair’s moves between the last December and January 2023. Even so, the quote remains on the bull’s radar as it keeps the previous week’s upside break of the key hurdles, now supports.
That said, the RSI retreat from the overbought territory and hence consolidation of the latest run-up appears logical. However, the bullish MACD signals and the successful trading beyond the resistance-turned-support levels seem to favor the Yen pair buyers.
The 200-SMA level surrounding 130.80 appears to be the immediate support for the USD/JPY bears to watch ahead of the 130.00 psychological magnet.
Following that, the previous resistance line from mid-December 2022, near 129.40 at the latest, could act as the last defense of the USD/JPY bulls.
On the contrary, a clear upside break of the 50% Fibonacci retracement level of 132.75 could propel the USD/JPY towards the 61.8% Fibonacci retracement, also known as the golden level of 134.05.
Even if the Yen pair remains firmer past 134.05, January’s top close to 134.80 may challenge the upside momentum.
Trend: Further upside expected
Technical Levels: Supports and Resistances
USDJPY currently trading at 132.28 at the time of writing. Pair opened at 132.62 and is trading with a change of -0.26% % .
| Overview | Overview.1 | |
|---|---|---|
| 0 | Today last price | 132.28 |
| 1 | Today Daily Change | -0.34 |
| 2 | Today Daily Change % | -0.26% |
| 3 | Today daily open | 132.62 |
The pair is trading above its 20 Daily moving average @ 129.9, below its 50 Daily moving average @ 132.69 , below its 100 Daily moving average @ 138.68 and below its 200 Daily moving average @ 136.8
| Trends | Trends.1 | |
|---|---|---|
| 0 | Daily SMA20 | 129.90 |
| 1 | Daily SMA50 | 132.69 |
| 2 | Daily SMA100 | 138.68 |
| 3 | Daily SMA200 | 136.80 |
The previous day high was 132.91 while the previous day low was 131.18. The daily 38.2% Fib levels comes at 132.25, expected to provide support. Similarly, the daily 61.8% fib level is at 131.84, expected to provide support.
Note the levels of interest below:
- Pivot support is noted at 131.57, 130.52, 129.85
- Pivot resistance is noted at 133.29, 133.96, 135.01
| Levels | Levels.1 |
|---|---|
| Previous Daily High | 132.91 |
| Previous Daily Low | 131.18 |
| Previous Weekly High | 131.20 |
| Previous Weekly Low | 128.08 |
| Previous Monthly High | 134.78 |
| Previous Monthly Low | 127.22 |
| Daily Fibonacci 38.2% | 132.25 |
| Daily Fibonacci 61.8% | 131.84 |
| Daily Pivot Point S1 | 131.57 |
| Daily Pivot Point S2 | 130.52 |
| Daily Pivot Point S3 | 129.85 |
| Daily Pivot Point R1 | 133.29 |
| Daily Pivot Point R2 | 133.96 |
| Daily Pivot Point R3 | 135.01 |
[/s2If]
Join Our Telegram Group
")


