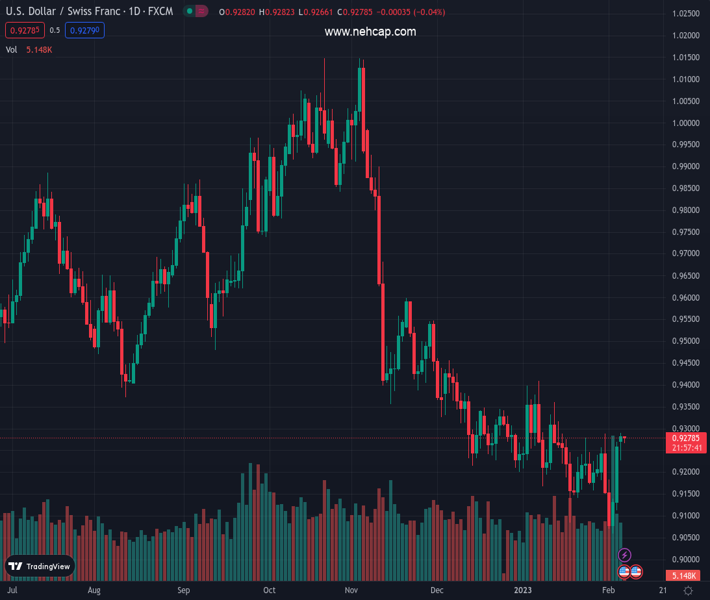
#USDCHF @ 0.92797 is displaying a lackluster performance after reaching to near the 0.9280-0.9290 supply zone. (Pivot Orderbook analysis)
…
This is a premium post.
[s2If !current_user_can(access_s2member_level4)]Please register for PREMIUM VERSION HERE to read full post below containing analysis. In case of any error or you think you are not able to read the full post below, please email us at support#nehcap.com [lwa][/s2If] [s2If current_user_can(access_s2member_level4)]
- USD/CHF is displaying a lackluster performance after reaching to near the 0.9280-0.9290 supply zone.
- Fresh commentary from US President that the balloon incident doesn’t weaken US-China relations might improve risk appetite.
- An acceptance above the 0.9280-0.9290 supply zone is required for a fresh upside.
The pair currently trades last at 0.92797.
The previous day high was 0.927 while the previous day low was 0.9126. The daily 38.2% Fib levels comes at 0.9215, expected to provide support. Similarly, the daily 61.8% fib level is at 0.9181, expected to provide support.
The USD/CHF pair is demonstrating a loss in the upside momentum after reaching to near the round-level resistance of 0.9300 in the early Tokyo session. The Swiss franc asset is struggling to extend gains ahead of the commentary from Federal Reserve (Fed) Chair Jerome Powell.
Risk-perceived assets remained jittery on US-China tensions and fresh risk of United States recession amid deepening expectations of further policy tightening by the Fed. However, fresh commentary from US President Joe Biden that the balloon incident doesn’t weaken US-China relations might improve the risk appetite of the market participants.
The US Dollar Index (DXY) is expected to remain lackluster after a three-day winning streak as investors await fresh triggers for acceptance at elevated levels.
After reaching to the supply zone in a 0.9280-0.9290 range, USD/CHF has sensed barricades amid an absence of acceptance signs at elevated levels. The Swiss franc asset is showing an inventory adjustment, which conveys that the US Dollar is gathering strength for a confident breakout.
The 20-period Exponential Moving Average (EMA) at 0.9267 is acting as a major support for the US Dollar bulls.
Meanwhile, the Relative Strength Index (RSI) (14) has yet not surrendered the oscillation in the bullish range of 60.00-80.00, which indicates that the upside momentum is still active.
Going forward, a break above the supply zone in a 0.9280-0.9290 range will expose the asset to January 12 high around 0.9360 followed by the round-level resistance at 0.9400.
On the flip side, a breakdown of Wednesday’s low at 0.9059 will drag the major toward 4 August 2021 low at 0.9018. A slippage below the latter will drag the asset further toward 10 May 2021 low at 0.8986.
Technical Levels: Supports and Resistances
USDCHF currently trading at 0.928 at the time of writing. Pair opened at 0.9263 and is trading with a change of 0.18 % .
| Overview | Overview.1 | |
|---|---|---|
| 0 | Today last price | 0.9280 |
| 1 | Today Daily Change | 0.0017 |
| 2 | Today Daily Change % | 0.1800 |
| 3 | Today daily open | 0.9263 |
The pair is trading above its 20 Daily moving average @ 0.9212, below its 50 Daily moving average @ 0.9288 , below its 100 Daily moving average @ 0.9548 and below its 200 Daily moving average @ 0.9619
| Trends | Trends.1 | |
|---|---|---|
| 0 | Daily SMA20 | 0.9212 |
| 1 | Daily SMA50 | 0.9288 |
| 2 | Daily SMA100 | 0.9548 |
| 3 | Daily SMA200 | 0.9619 |
The previous day high was 0.927 while the previous day low was 0.9126. The daily 38.2% Fib levels comes at 0.9215, expected to provide support. Similarly, the daily 61.8% fib level is at 0.9181, expected to provide support.
Note the levels of interest below:
- Pivot support is noted at 0.9169, 0.9076, 0.9026
- Pivot resistance is noted at 0.9313, 0.9363, 0.9456
| Levels | Levels.1 |
|---|---|
| Previous Daily High | 0.9270 |
| Previous Daily Low | 0.9126 |
| Previous Weekly High | 0.9288 |
| Previous Weekly Low | 0.9059 |
| Previous Monthly High | 0.9410 |
| Previous Monthly Low | 0.9085 |
| Daily Fibonacci 38.2% | 0.9215 |
| Daily Fibonacci 61.8% | 0.9181 |
| Daily Pivot Point S1 | 0.9169 |
| Daily Pivot Point S2 | 0.9076 |
| Daily Pivot Point S3 | 0.9026 |
| Daily Pivot Point R1 | 0.9313 |
| Daily Pivot Point R2 | 0.9363 |
| Daily Pivot Point R3 | 0.9456 |
[/s2If]
Join Our Telegram Group
")


