#USDCHF @ 0.92200 will likely remain pressured following Powell’s “neutral” speech. (Pivot Orderbook analysis)
…
This is a premium post.
[s2If !current_user_can(access_s2member_level4)]Please register for PREMIUM VERSION HERE to read full post below containing analysis. In case of any error or you think you are not able to read the full post below, please email us at support#nehcap.com [lwa][/s2If] [s2If current_user_can(access_s2member_level4)]
- USD/CHF will likely remain pressured following Powell’s “neutral” speech.
- USD/CHF Price Analysis: Downward biased, but it could print a leg-up once it clears the 50-day EMA.
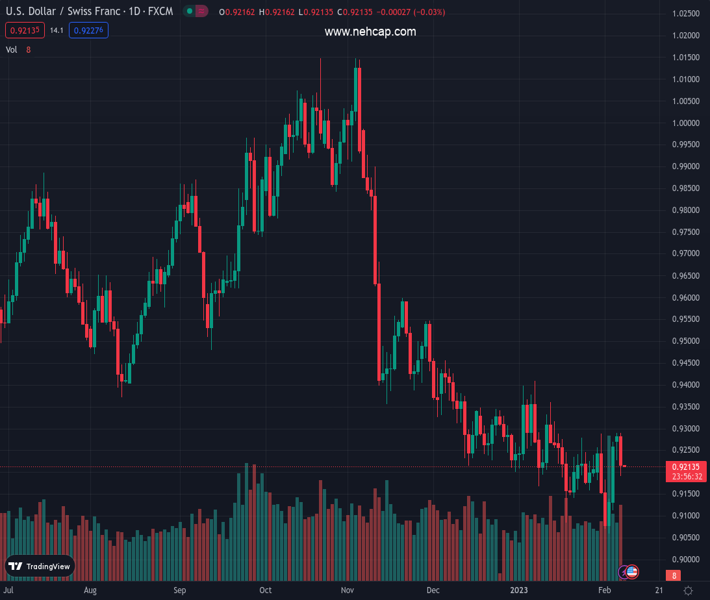
The pair currently trades last at 0.92200.
The previous day high was 0.9291 while the previous day low was 0.9227. The daily 38.2% Fib levels comes at 0.9267, expected to provide resistance. Similarly, the daily 61.8% fib level is at 0.9252, expected to provide resistance.
USD/CHF slid from weekly highs and reached around 0.9290 after the US Federal Reserve (Fed) Chair Powell’s speech failed to push back against a perceived dovish rate hike, even though he acknowledged a strong US jobs report. At the time of writing, the USD/CHF exchanges hands at 0.9219, below its opening price.
The USD/CHF is resting at around the 20-day Exponential Moving Average (EMA) at 0.9217 as Wall Street’s session wanes. Failure to crack the latter would keep USD/CHF bulls hopeful for higher prices, but they will need to challenge the 50-day EMA at 0.9303 if they want to shift the bias to neutral upwards. In that outcome, the USD/CHF could aim higher and face the next supply zone at a downslope trendline drawn from December’s highs, which passes in the 0.9320-35 area. Once cleared, the 100-day EMA would be up for grabs at 0.9420.
For a resumption of the downtrend, the USD/CHF needs a break below the 20-day EMA and February 7 low of 0.9191. A breach of the latter will poise the USD/CHF pair towards the February 3 daily low of 0.9112, ahead of the 0.9100 figure.
Momentum indicators are beginning to show bearish signals, with the Relative Strength Index (RSI) crossing below the 50-mid line. The Rate of Change (RoC) portrays buying pressure is fading, strengthening the bearish outlook in the near term.
Technical Levels: Supports and Resistances
USDCHF currently trading at 0.9222 at the time of writing. Pair opened at 0.9281 and is trading with a change of -0.64 % .
| Overview | Overview.1 | |
|---|---|---|
| 0 | Today last price | 0.9222 |
| 1 | Today Daily Change | -0.0059 |
| 2 | Today Daily Change % | -0.6400 |
| 3 | Today daily open | 0.9281 |
The pair is trading above its 20 Daily moving average @ 0.9215, below its 50 Daily moving average @ 0.9284 , below its 100 Daily moving average @ 0.9544 and below its 200 Daily moving average @ 0.9617
| Trends | Trends.1 | |
|---|---|---|
| 0 | Daily SMA20 | 0.9215 |
| 1 | Daily SMA50 | 0.9284 |
| 2 | Daily SMA100 | 0.9544 |
| 3 | Daily SMA200 | 0.9617 |
The previous day high was 0.9291 while the previous day low was 0.9227. The daily 38.2% Fib levels comes at 0.9267, expected to provide resistance. Similarly, the daily 61.8% fib level is at 0.9252, expected to provide resistance.
Note the levels of interest below:
- Pivot support is noted at 0.9242, 0.9203, 0.9178
- Pivot resistance is noted at 0.9305, 0.933, 0.9369
| Levels | Levels.1 |
|---|---|
| Previous Daily High | 0.9291 |
| Previous Daily Low | 0.9227 |
| Previous Weekly High | 0.9288 |
| Previous Weekly Low | 0.9059 |
| Previous Monthly High | 0.9410 |
| Previous Monthly Low | 0.9085 |
| Daily Fibonacci 38.2% | 0.9267 |
| Daily Fibonacci 61.8% | 0.9252 |
| Daily Pivot Point S1 | 0.9242 |
| Daily Pivot Point S2 | 0.9203 |
| Daily Pivot Point S3 | 0.9178 |
| Daily Pivot Point R1 | 0.9305 |
| Daily Pivot Point R2 | 0.9330 |
| Daily Pivot Point R3 | 0.9369 |
[/s2If]
Join Our Telegram Group
")


