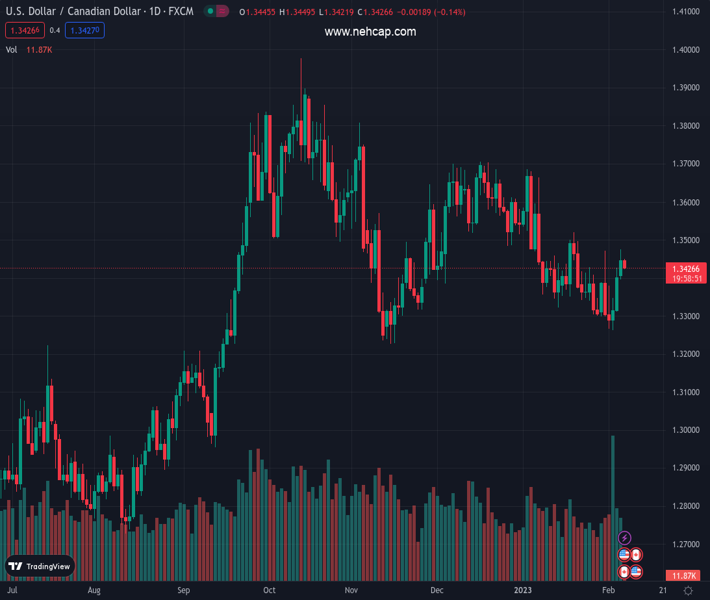
#USDCAD @ 1.34220 snaps three-day uptrend as it eases from two-week high. (Pivot Orderbook analysis)
…
This is a premium post.
[s2If !current_user_can(access_s2member_level4)]Please register for PREMIUM VERSION HERE to read full post below containing analysis. In case of any error or you think you are not able to read the full post below, please email us at support#nehcap.com [lwa][/s2If] [s2If current_user_can(access_s2member_level4)]
- USD/CAD snaps three-day uptrend as it eases from two-week high.
- Cautious optimism in the market allows WTI crude oil to remain firmer.
- US Dollar retreats amid anxiety over Powell’s speech after the last week’s disappointment from Fed.
- BoC’s Macklem needs to defend the hawkish bias to please bears.
The pair currently trades last at 1.34220.
The previous day high was 1.3476 while the previous day low was 1.3397. The daily 38.2% Fib levels comes at 1.3446, expected to provide resistance. Similarly, the daily 61.8% fib level is at 1.3427, expected to provide resistance.
USD/CAD holds lower grounds near the intraday bottom during the first negative daily performance in four, mildly offered near 1.3430 amid early Tuesday. Even so, the Loonie pair remains near the highest levels in 12 days as traders await speeches from Bank of Canada (BoC) Governor Tiff Macklem and Federal Reserve (Fed) Chairman Jerome Powell.
The quote’s latest weakness could be linked to the market’s mildly positive sentiment amid receding recession fears. Adding strength to the pullback moves could be the firmer prices of WTI crude oil, Canada’s key export item.
That said, WTI crude oil rises 0.40% to $75.00 while extending the previous day’s rebound from a two-month low. The black gold’s recovery could be linked to the easing fears of the US economic slowdown, as well as recent positive headlines surrounding the Sino-American ties.
Although the US economic calendar was mostly silent but growth optimism conveyed by US Treasury Secretary Janet Yellen and President Joe Biden seemed to have probed the US Dollar bulls. Even so, joined hawkish Fed talks seem to put a floor under the US Treasury bond yields, as well as the US Dollar. “The strong labor market probably means ‘we have to do a little more work,’” said Federal Reserve Bank of Atlanta President Raphel Bostic in an interview with Bloomberg.
Elsewhere, a dash on the US diplomatic visit to Beijing and China’s harsh reaction to the US shooting down its balloon by terming it a spying attempt triggered the market’s risk-off mood and propelled the USD/CAD pair the previous day. However, the latest comments from US President Joe Bide appear soothing on the matter as he said, “The balloon incident does not weaken US-China relations.”
While portraying the mood, S&P 500 Futures print mild gains but the US 10-year Treasury bond struggled for clear directions around 3.63%, after a two-day rebound from the monthly low.
Furthermore, upbeat prints of the Canada Ivey Purchasing Managers Index for January, 60.1 versus 55.2 expected and 49.3 prior, also seem to exert downside pressure on the USD/CAD price.
Looking forward, USD/CAD traders could initially react to the Canadian trade numbers for December. However, speeches from BoC’s Macklem, Fed’s Powell and US President Joe Biden’s State of the Union (SOTU) will be crucial for clear directions.
Another failure to cross the 50-day Exponential Moving Average (EMA), around 1.3450 by the press time, keeps USD/CAD bears hopeful.
Technical Levels: Supports and Resistances
USDCAD currently trading at 1.3432 at the time of writing. Pair opened at 1.3443 and is trading with a change of -0.08% % .
| Overview | Overview.1 | |
|---|---|---|
| 0 | Today last price | 1.3432 |
| 1 | Today Daily Change | -0.0011 |
| 2 | Today Daily Change % | -0.08% |
| 3 | Today daily open | 1.3443 |
The pair is trading above its 20 Daily moving average @ 1.3383, below its 50 Daily moving average @ 1.3498 , below its 100 Daily moving average @ 1.3536 and above its 200 Daily moving average @ 1.3225
| Trends | Trends.1 | |
|---|---|---|
| 0 | Daily SMA20 | 1.3383 |
| 1 | Daily SMA50 | 1.3498 |
| 2 | Daily SMA100 | 1.3536 |
| 3 | Daily SMA200 | 1.3225 |
The previous day high was 1.3476 while the previous day low was 1.3397. The daily 38.2% Fib levels comes at 1.3446, expected to provide resistance. Similarly, the daily 61.8% fib level is at 1.3427, expected to provide resistance.
Note the levels of interest below:
- Pivot support is noted at 1.3401, 1.3359, 1.3322
- Pivot resistance is noted at 1.348, 1.3517, 1.3559
| Levels | Levels.1 |
|---|---|
| Previous Daily High | 1.3476 |
| Previous Daily Low | 1.3397 |
| Previous Weekly High | 1.3472 |
| Previous Weekly Low | 1.3262 |
| Previous Monthly High | 1.3685 |
| Previous Monthly Low | 1.3300 |
| Daily Fibonacci 38.2% | 1.3446 |
| Daily Fibonacci 61.8% | 1.3427 |
| Daily Pivot Point S1 | 1.3401 |
| Daily Pivot Point S2 | 1.3359 |
| Daily Pivot Point S3 | 1.3322 |
| Daily Pivot Point R1 | 1.3480 |
| Daily Pivot Point R2 | 1.3517 |
| Daily Pivot Point R3 | 1.3559 |
[/s2If]
Join Our Telegram Group
")


