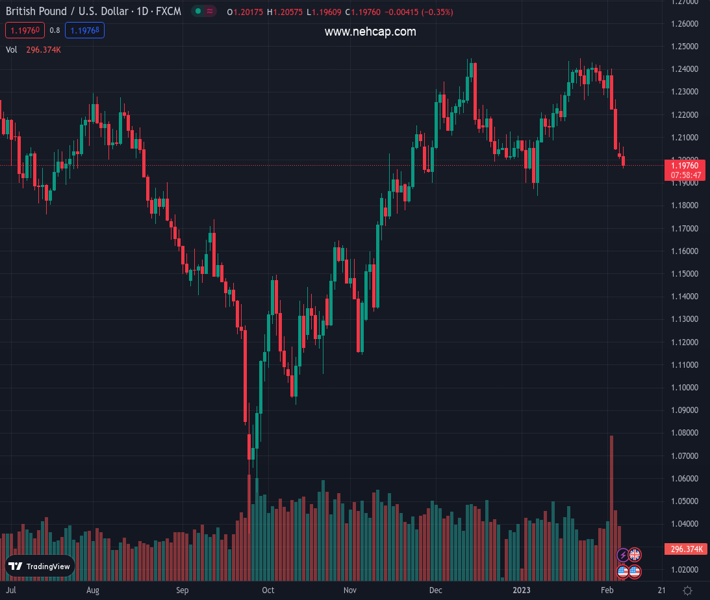
#GBPUSD @ 1.19772 turns lower for the fourth successive day and drops to a fresh one-month low. (Pivot Orderbook analysis)
…
This is a premium post.
[s2If !current_user_can(access_s2member_level4)]Please register for PREMIUM VERSION HERE to read full post below containing analysis. In case of any error or you think you are not able to read the full post below, please email us at support#nehcap.com [lwa][/s2If] [s2If current_user_can(access_s2member_level4)]
- GBP/USD turns lower for the fourth successive day and drops to a fresh one-month low.
- Hawkish Fed expectations, a softer risk tone underpins the USD and exerts some pressure.
- Traders look forward to Fed Chair Jerome Powell’s speech for some meaningful impetus.
The pair currently trades last at 1.19772.
The previous day high was 1.2078 while the previous day low was 1.2006. The daily 38.2% Fib levels comes at 1.2033, expected to provide resistance. Similarly, the daily 61.8% fib level is at 1.205, expected to provide resistance.
The GBP/USD pair attracts fresh sellers following an intraday uptick to the 1.2055 area and turns lower for the fourth successive day on Tuesday. Spot prices drop to a fresh one-month low heading into the North American session, with bears now eyeing to challenge a technically significant 200-day SMA near mid-1.1900s.
The US Dollar reverses an intraday dip and holds steady near a one-month peak touched on Monday, which, in turn, is seen exerting downward pressure on the GBP/USD pair. The upbeat US monthly jobs data (NFP) released last week fueled speculations that the Federal Reserve (Fed) will stick to its hawkish stance. This, in turn, remains supportive of a modest intraday uptick in the US Treasury bond yields and acts as a tailwind for the greenback.
In contrast, the Bank of England last week signalled that it was close to pausing the current rate-hiking cycle. In fact, the UK central bank removed the phrase that they would “respond forcefully, as necessary”. Furthermore, BoE Governor Andrew Bailey said that inflation will fall more rapidly during the second half of 2023. This, in turn, is seen weighing on the British Pound and contributing to the offered tone surrounding the GBP/USD pair.
Apart from this, the prevalent cautious market mood – amid looming recession risks – further benefits the greenback’s relative safe-haven status against its British counterpart. Tuesday’s intraday slide could also be attributed to some technical selling below the 1.2000 psychological mark. This, in turn, supports prospects for an extension of the depreciating move, though traders might wait for Fed Chair Jerome Powell’s speech for a fresh impetus.
Investors will closely scrutinize Powell’s comments on inflation and monetary policy for clues about the Fed’s future rate-hike path. This, in turn, will play a key role in influencing the near-term USD price dynamics and produce some meaningful trading opportunities around the GBP/USD pair in the absence of any relevant market-moving economic releases.
Technical Levels: Supports and Resistances
GBPUSD currently trading at 1.197 at the time of writing. Pair opened at 1.2023 and is trading with a change of -0.44 % .
| Overview | Overview.1 | |
|---|---|---|
| 0 | Today last price | 1.1970 |
| 1 | Today Daily Change | -0.0053 |
| 2 | Today Daily Change % | -0.4400 |
| 3 | Today daily open | 1.2023 |
The pair is trading below its 20 Daily moving average @ 1.2281, below its 50 Daily moving average @ 1.2191 , above its 100 Daily moving average @ 1.181 and above its 200 Daily moving average @ 1.1953
| Trends | Trends.1 | |
|---|---|---|
| 0 | Daily SMA20 | 1.2281 |
| 1 | Daily SMA50 | 1.2191 |
| 2 | Daily SMA100 | 1.1810 |
| 3 | Daily SMA200 | 1.1953 |
The previous day high was 1.2078 while the previous day low was 1.2006. The daily 38.2% Fib levels comes at 1.2033, expected to provide resistance. Similarly, the daily 61.8% fib level is at 1.205, expected to provide resistance.
Note the levels of interest below:
- Pivot support is noted at 1.1993, 1.1964, 1.1922
- Pivot resistance is noted at 1.2065, 1.2107, 1.2137
| Levels | Levels.1 |
|---|---|
| Previous Daily High | 1.2078 |
| Previous Daily Low | 1.2006 |
| Previous Weekly High | 1.2418 |
| Previous Weekly Low | 1.2050 |
| Previous Monthly High | 1.2448 |
| Previous Monthly Low | 1.1841 |
| Daily Fibonacci 38.2% | 1.2033 |
| Daily Fibonacci 61.8% | 1.2050 |
| Daily Pivot Point S1 | 1.1993 |
| Daily Pivot Point S2 | 1.1964 |
| Daily Pivot Point S3 | 1.1922 |
| Daily Pivot Point R1 | 1.2065 |
| Daily Pivot Point R2 | 1.2107 |
| Daily Pivot Point R3 | 1.2137 |
[/s2If]
Join Our Telegram Group
")


