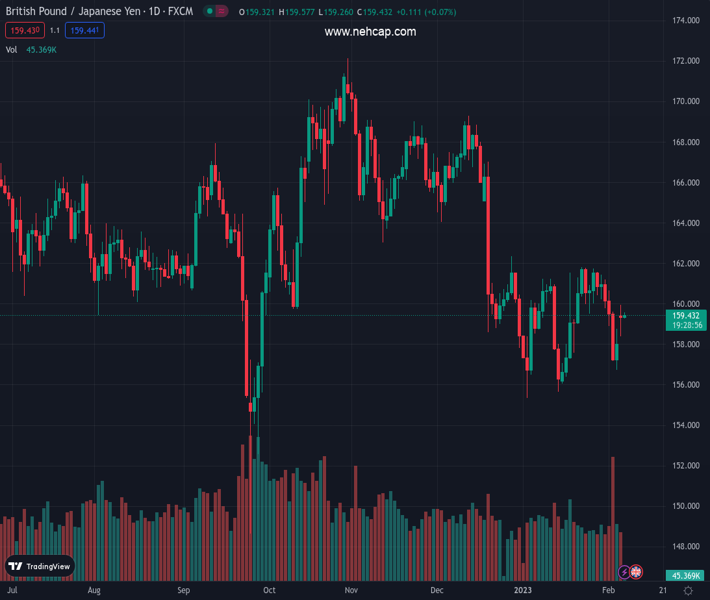
#GBPJPY @ 159.434 bulls struggle to keep the reins after two-day uptrend., @nehcap view: Pullback expected (Pivot Orderbook analysis)
…
This is a premium post.
[s2If !current_user_can(access_s2member_level4)]Please register for PREMIUM VERSION HERE to read full post below containing analysis. In case of any error or you think you are not able to read the full post below, please email us at support#nehcap.com [lwa][/s2If] [s2If current_user_can(access_s2member_level4)]
- GBP/JPY bulls struggle to keep the reins after two-day uptrend.
- 10-DMA, 21-DMA and two-month-old resistance line challenge immediate upside amid sluggish MACD.
- Bears should wait for 61.8% Fibonacci retracement breakdown.
The pair currently trades last at 159.434.
The previous day high was 159.96 while the previous day low was 158.15. The daily 38.2% Fib levels comes at 159.26, expected to provide support. Similarly, the daily 61.8% fib level is at 158.84, expected to provide support.
GBP/JPY makes rounds to 159.40 while fading the two-day uptrend during early Tuesday. In doing so, the cross-currency pair jostles with the 10-DMA hurdle amid a sluggish session, as portrayed by the indecisive MACD.
Even if the quote crosses the immediate DMA resistance surrounding 159.50, which is less expected due to the MACD conditions, the 21-DMA could challenge the GBP/JPY buyers around 159.90.
Following that, the 160.00 round figure and a downward-sloping resistance line from December 13, 2022, close to 160.15 by the press time, appear as the last defense for the GBP/JPY bears before giving control to the bulls.
In that case, the previous monthly high and late December swing top, respectively near 161.85 and 162.35, will be in focus.
On the flip side, the 61.8% Fibonacci retracement level of the cross-currency pair’s September-October 2022 upside, near 157.65, puts a floor under the GBP/JPY price.
Also acting as the key support is an upward-sloping support line from the last September, close to 156.85 by the press time.
Should the GBP/JPY price stays weaker past 156.85, the odds of witnessing a slump toward the previous monthly low near 155.35 can’t be ruled out.
Trend: Pullback expected
Technical Levels: Supports and Resistances
GBPJPY currently trading at 159.46 at the time of writing. Pair opened at 159.46 and is trading with a change of 0.00% % .
| Overview | Overview.1 | |
|---|---|---|
| 0 | Today last price | 159.46 |
| 1 | Today Daily Change | 0.00 |
| 2 | Today Daily Change % | 0.00% |
| 3 | Today daily open | 159.46 |
The pair remains strongly bearish on the daily time frame. It trades below the 20 SMA @ 159.52, 50 SMA 161.75, 100 SMA @ 163.51 and 200 SMA @ 163.29.
| Trends | Trends.1 | |
|---|---|---|
| 0 | Daily SMA20 | 159.52 |
| 1 | Daily SMA50 | 161.75 |
| 2 | Daily SMA100 | 163.51 |
| 3 | Daily SMA200 | 163.29 |
The previous day high was 159.96 while the previous day low was 158.15. The daily 38.2% Fib levels comes at 159.26, expected to provide support. Similarly, the daily 61.8% fib level is at 158.84, expected to provide support.
Note the levels of interest below:
- Pivot support is noted at 158.42, 157.38, 156.61
- Pivot resistance is noted at 160.23, 161.0, 162.04
| Levels | Levels.1 |
|---|---|
| Previous Daily High | 159.96 |
| Previous Daily Low | 158.15 |
| Previous Weekly High | 161.43 |
| Previous Weekly Low | 156.73 |
| Previous Monthly High | 161.85 |
| Previous Monthly Low | 155.36 |
| Daily Fibonacci 38.2% | 159.26 |
| Daily Fibonacci 61.8% | 158.84 |
| Daily Pivot Point S1 | 158.42 |
| Daily Pivot Point S2 | 157.38 |
| Daily Pivot Point S3 | 156.61 |
| Daily Pivot Point R1 | 160.23 |
| Daily Pivot Point R2 | 161.00 |
| Daily Pivot Point R3 | 162.04 |
[/s2If]
Join Our Telegram Group
")


