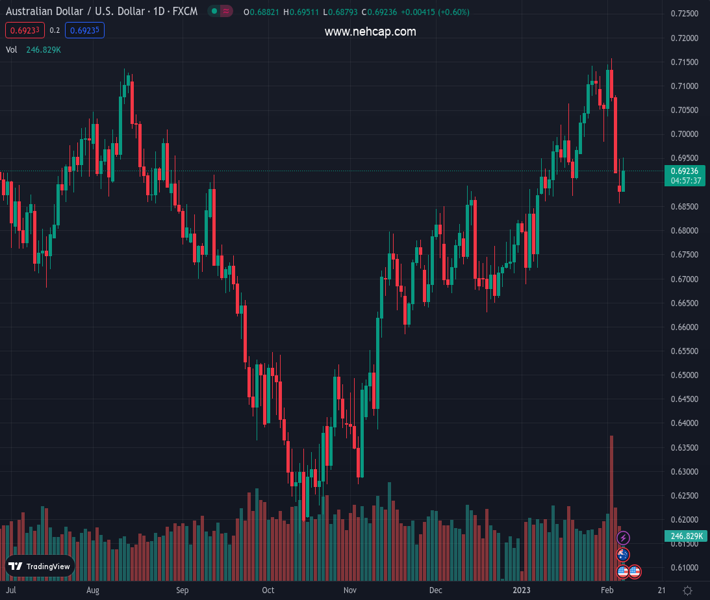
#AUDUSD @ 0.69235 resumes its uptrend after touching five-week lows around 0.6850. (Pivot Orderbook analysis)
…
This is a premium post.
[s2If !current_user_can(access_s2member_level4)]Please register for PREMIUM VERSION HERE to read full post below containing analysis. In case of any error or you think you are not able to read the full post below, please email us at support#nehcap.com [lwa][/s2If] [s2If current_user_can(access_s2member_level4)]
- AUD/USD resumes its uptrend after touching five-week lows around 0.6850.
- The RBA raised rates by 25 bps and projects additional increases to the cash rate.
- AUD/USD Price Analysis: Upward biased, it might test 0.7000 in the near term.
The pair currently trades last at 0.69235.
The previous day high was 0.6948 while the previous day low was 0.6856. The daily 38.2% Fib levels comes at 0.6891, expected to provide support. Similarly, the daily 61.8% fib level is at 0.6913, expected to provide support.
The Australian Dollar (AUD) recovered some ground vs. the US Dollar (USD) after the Reserve Bank of Australia (RBA) raised rates by 25 bps in the Asian session, which triggered a jump to fresh two-day highs of 0.6951. Nevertheless, solid US economic data increased the Fed’s likelihood of further rate hikes. Hence, the AUD/USD retreated some but is still up 0.52, trading at 0.6920.
The AUD/USD is holding to its gains. The RBA’s decision to lift rates to the 3.35% threshold keeps the Aussie Dollar (AUD) positive in the day, clinging to gains above the psychological 0.6900 level. The RBA reiterated that further increases would be needed due to core inflation being higher than expected as the central bank tries to curb elevated inflation to its 2-3% target.
ANZ analysts expect the RBA to continue to raise the cash rate to 3.85%. “Today’s RBA statement spells out that further rate hikes are coming. We continue to expect that the cash rate target will rise another 25bp in March and then to 3.85% by May 2023. We still see the risks to that peak as tilted to the high side given the momentum in inflationary pressure.”
Aside from this, investors’ eyes would dissect each word of the US Federal Reserve (Fed) Chair Jerome Powell, who would cross wires at around 17:00 GMT. Solid US economic data revealed since the first week of February would likely keep the Fed pressured to deliver price stability. January’s staggering employment report has opened the door for further tightening.
In the early morning, Minnesota’s Fed President Neil Kashkari said that he foresees the Federal Fund rate at around 5.4% due to the stronger-than-expected labor market report, which showed that the US central bank needs to keep raising rates.
Technically speaking, the AUD/USD fell to a 5-week low but found support around the 0.6850 area and reclaimed the 50-day Exponential Moving Average (EMA), which rests at 0.6876. Nevertheless, for the AUD/USD to resume its uptrend, it needs a daily close above 0.6948, which would expose the pair to further buying pressure. That said, the AUD/USD next resistance would be the 20-day EMA at 0.6975, followed by the psychological 0.7000 figure, ahead of the February 3 high at 0.7080.
Technical Levels: Supports and Resistances
AUDUSD currently trading at 0.6921 at the time of writing. Pair opened at 0.6885 and is trading with a change of 0.52 % .
| Overview | Overview.1 | |
|---|---|---|
| 0 | Today last price | 0.6921 |
| 1 | Today Daily Change | 0.0036 |
| 2 | Today Daily Change % | 0.5200 |
| 3 | Today daily open | 0.6885 |
The pair is trading below its 20 Daily moving average @ 0.7002, above its 50 Daily moving average @ 0.6856 , above its 100 Daily moving average @ 0.6672 and above its 200 Daily moving average @ 0.681
| Trends | Trends.1 | |
|---|---|---|
| 0 | Daily SMA20 | 0.7002 |
| 1 | Daily SMA50 | 0.6856 |
| 2 | Daily SMA100 | 0.6672 |
| 3 | Daily SMA200 | 0.6810 |
The previous day high was 0.6948 while the previous day low was 0.6856. The daily 38.2% Fib levels comes at 0.6891, expected to provide support. Similarly, the daily 61.8% fib level is at 0.6913, expected to provide support.
Note the levels of interest below:
- Pivot support is noted at 0.6844, 0.6803, 0.6751
- Pivot resistance is noted at 0.6937, 0.6989, 0.703
| Levels | Levels.1 |
|---|---|
| Previous Daily High | 0.6948 |
| Previous Daily Low | 0.6856 |
| Previous Weekly High | 0.7158 |
| Previous Weekly Low | 0.6919 |
| Previous Monthly High | 0.7143 |
| Previous Monthly Low | 0.6688 |
| Daily Fibonacci 38.2% | 0.6891 |
| Daily Fibonacci 61.8% | 0.6913 |
| Daily Pivot Point S1 | 0.6844 |
| Daily Pivot Point S2 | 0.6803 |
| Daily Pivot Point S3 | 0.6751 |
| Daily Pivot Point R1 | 0.6937 |
| Daily Pivot Point R2 | 0.6989 |
| Daily Pivot Point R3 | 0.7030 |
[/s2If]
Join Our Telegram Group
")


