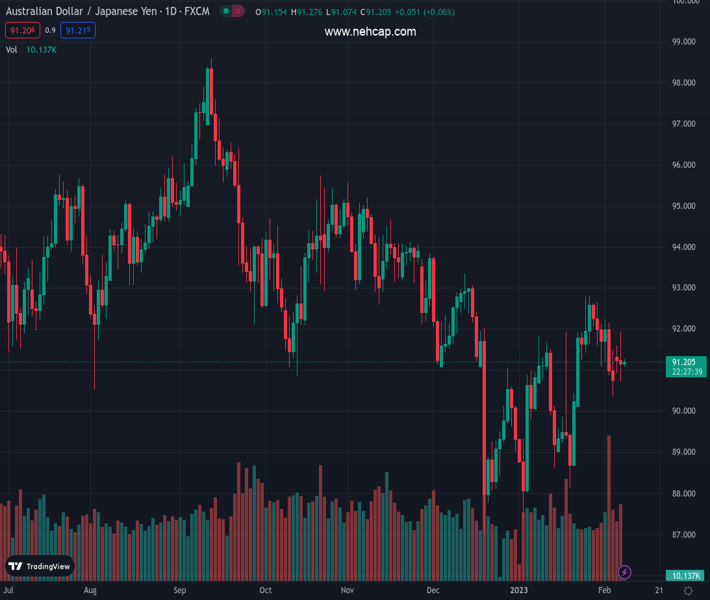
#AUDJPY @ 91.2020 remained sideways for the fourth consecutive day, unable to register new daily highs/lows. (Pivot Orderbook analysis)
…
This is a premium post.
[s2If !current_user_can(access_s2member_level4)]Please register for PREMIUM VERSION HERE to read full post below containing analysis. In case of any error or you think you are not able to read the full post below, please email us at support#nehcap.com [lwa][/s2If] [s2If current_user_can(access_s2member_level4)]
- AUD/JPY remained sideways for the fourth consecutive day, unable to register new daily highs/lows.
- AUD/JPY Price Analysis: In the short term, downward biased, and it can test the 90.00 figure.
The pair currently trades last at 91.2020.
The previous day high was 91.62 while the previous day low was 90.8. The daily 38.2% Fib levels comes at 91.3, expected to provide resistance. Similarly, the daily 61.8% fib level is at 91.11, expected to provide support.
As the Asian session begins, the AUD/JPY trims some of Tuesday’s losses, though it remains trapped within the 20 and 50-day Exponential Moving Averages (EMAs), each at 91.10 and 91.27, respectively. Tuesday’s session was volatile, with the AUD/JPY reaching a weekly high of 91.93 before collapsing toward the day’s low on an intervention in the FX markets by Japanese authorities. The AUD/JPY is trading at 91.22, registering minimal gains of 0.07%.
After Tuesday’s session, the AUD/JPY shifted neutral, with most of the Exponential Moving Averages (EMAs) staying at around 91.10-91.87. However, the AUD/JPY pair is slightly tilted to the downside since consolidating on January 26, recording successive series of lower highs/lows, meaning that in the near term, the AUD/JPY pair is downwards.
Hence, the AUD/JPY first support would be the 20-day EMA at 91.10. A breach of the latter would expose the 91.00 psychological level, which, once cleared, might send the pair diving towards the February 3 swing low at 90.34.
As an alternate scenario, the AUD/JPY supply zone would be the 50-day EMA at 91.27. Moving upwards from that level and the AUD/JPY would test the 200-day and 100-day EMAs, each at 91.52 and 91.86, respectively. Once broken, the 92.00 figure is up for grabs.
Technical Levels: Supports and Resistances
AUDJPY currently trading at 91.29 at the time of writing. Pair opened at 91.3 and is trading with a change of -0.01 % .
| Overview | Overview.1 | |
|---|---|---|
| 0 | Today last price | 91.29 |
| 1 | Today Daily Change | -0.01 |
| 2 | Today Daily Change % | -0.01 |
| 3 | Today daily open | 91.30 |
The pair is trading above its 20 Daily moving average @ 90.95, above its 50 Daily moving average @ 90.94 , below its 100 Daily moving average @ 92.38 and below its 200 Daily moving average @ 93.03
| Trends | Trends.1 | |
|---|---|---|
| 0 | Daily SMA20 | 90.95 |
| 1 | Daily SMA50 | 90.94 |
| 2 | Daily SMA100 | 92.38 |
| 3 | Daily SMA200 | 93.03 |
The previous day high was 91.62 while the previous day low was 90.8. The daily 38.2% Fib levels comes at 91.3, expected to provide resistance. Similarly, the daily 61.8% fib level is at 91.11, expected to provide support.
Note the levels of interest below:
- Pivot support is noted at 90.87, 90.43, 90.06
- Pivot resistance is noted at 91.68, 92.05, 92.49
| Levels | Levels.1 |
|---|---|
| Previous Daily High | 91.62 |
| Previous Daily Low | 90.80 |
| Previous Weekly High | 92.66 |
| Previous Weekly Low | 90.24 |
| Previous Monthly High | 92.82 |
| Previous Monthly Low | 87.41 |
| Daily Fibonacci 38.2% | 91.30 |
| Daily Fibonacci 61.8% | 91.11 |
| Daily Pivot Point S1 | 90.87 |
| Daily Pivot Point S2 | 90.43 |
| Daily Pivot Point S3 | 90.06 |
| Daily Pivot Point R1 | 91.68 |
| Daily Pivot Point R2 | 92.05 |
| Daily Pivot Point R3 | 92.49 |
[/s2If]
Join Our Telegram Group
")


