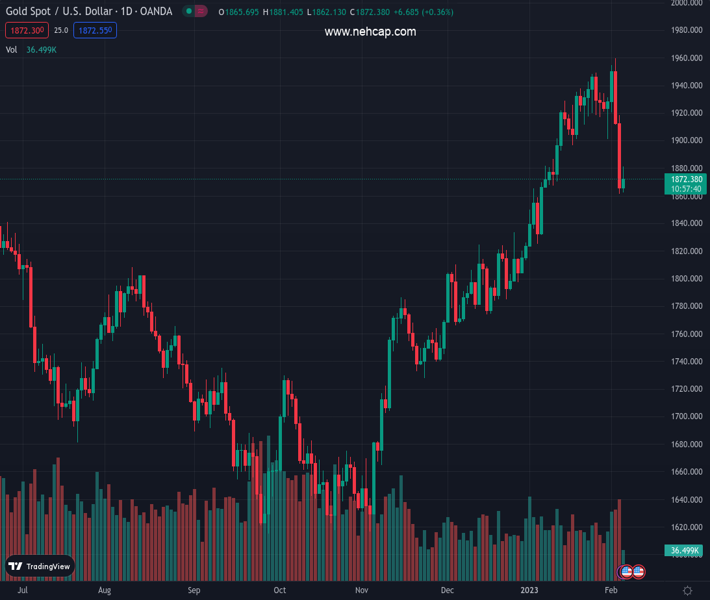
#XAUUSD @ 1,871.96 Gold price catches some bids on Monday and stages a recovery from a nearly four-week low. (Pivot Orderbook analysis)
…
This is a premium post.
[s2If !current_user_can(access_s2member_level4)]Please register for PREMIUM VERSION HERE to read full post below containing analysis. In case of any error or you think you are not able to read the full post below, please email us at support#nehcap.com [lwa][/s2If] [s2If current_user_can(access_s2member_level4)]
- Gold price catches some bids on Monday and stages a recovery from a nearly four-week low.
- The prevalent risk-off environment is seen lending some support to the safe-haven commodity.
- Hawkish Fed expectations, rising US bond yields underpin the US Dollar and cap the upside.
The pair currently trades last at 1871.96.
The previous day high was 1918.65 while the previous day low was 1861.45. The daily 38.2% Fib levels comes at 1883.3, expected to provide resistance. Similarly, the daily 61.8% fib level is at 1896.8, expected to provide resistance.
Gold price attracts some buyers near the $1,860 region, or a nearly four-week low touched earlier this Monday and sticks to its modest gains through the first half of the European session. The XAU/USD, for now, seems to have snapped a two-day losing streak and stalled the recent pullback from its highest level since April 2022 touched last week.
The prevalent risk-off environment – as depicted by a generally weaker tone around the equity markets – turns out to be a key factor lending support to the safe-haven Gold price. The global risk sentiment takes a hit amid fears of worsening US-China relations, especially after Washington’s decision last week to shoot down a Chinese balloon that traversed American airspace. This comes amid concerns about a strong recovery in the Chinese economy and the economic headwinds stemming from the continuous rise in borrowing costs.
That said, a combination of factors holds back bulls from placing aggressive bets around Gold price and keeps a lid on any meaningful upside, at least for the time being. The upbeat monthly jobs report released from the United States (US) on Friday fueled speculations that the Federal Reserve (Fed) will stick to its hawkish stance for longer. This, in turn, pushes the US Treasury bond yields higher, which underpins the US Dollar (USD) and acts as a headwind for the non-yielding yellow metal, at least for the time being.
In fact, the USD Index, which tracks the Greenback against a basket of currencies, is seen building on Friday’s post-NFP strong recovery from a nine-month low. This might further contribute to capping gains for the US Dollar-denominated Gold price. Hence, it will be prudent to wait for strong follow-through buying before confirming that the recent corrective decline from a multi-month top has run its course. Furthermore, absent relevant market-moving economic data warrants caution before positioning for any further upside.
From a technical perspective, weakness below the multi-week low, around the $1,860 region, could drag the Gold price to the $1,825 horizontal support en route to the $1,800 round-figure mark. This is followed by the very important 200-day Simple Moving Average (SMA), currently around the $1,776-$1,775 area. The latter should act as a pivotal point, which if broken decisively should set the stage for a deeper corrective decline.
On the flip side, any subsequent move up is likely to confront some resistance near the $1,890-$1.892 zone ahead of the $1,900 mark. A sustained strength beyond has the potential to lift the Gold price to the $1,920 horizontal barrier, above which a bout of a short-covering move could push the XAU/USD towards the $1,950 region. This is closely followed by the multi-month peak, around the $1,960 area touched last week. A sustained strength beyond the latter should allow bulls to aim to conquer the $2,000 psychological mark for the first time since March 2022.
Technical Levels: Supports and Resistances
XAUUSD currently trading at 1873.21 at the time of writing. Pair opened at 1864.86 and is trading with a change of 0.45 % .
| Overview | Overview.1 | |
|---|---|---|
| 0 | Today last price | 1873.21 |
| 1 | Today Daily Change | 8.35 |
| 2 | Today Daily Change % | 0.45 |
| 3 | Today daily open | 1864.86 |
The pair is trading below its 20 Daily moving average @ 1914.36, above its 50 Daily moving average @ 1846.04 , above its 100 Daily moving average @ 1766.47 and above its 200 Daily moving average @ 1775.99
| Trends | Trends.1 | |
|---|---|---|
| 0 | Daily SMA20 | 1914.36 |
| 1 | Daily SMA50 | 1846.04 |
| 2 | Daily SMA100 | 1766.47 |
| 3 | Daily SMA200 | 1775.99 |
The previous day high was 1918.65 while the previous day low was 1861.45. The daily 38.2% Fib levels comes at 1883.3, expected to provide resistance. Similarly, the daily 61.8% fib level is at 1896.8, expected to provide resistance.
Note the levels of interest below:
- Pivot support is noted at 1844.66, 1824.45, 1787.46
- Pivot resistance is noted at 1901.86, 1938.85, 1959.06
| Levels | Levels.1 |
|---|---|
| Previous Daily High | 1918.65 |
| Previous Daily Low | 1861.45 |
| Previous Weekly High | 1959.80 |
| Previous Weekly Low | 1861.45 |
| Previous Monthly High | 1949.27 |
| Previous Monthly Low | 1823.76 |
| Daily Fibonacci 38.2% | 1883.30 |
| Daily Fibonacci 61.8% | 1896.80 |
| Daily Pivot Point S1 | 1844.66 |
| Daily Pivot Point S2 | 1824.45 |
| Daily Pivot Point S3 | 1787.46 |
| Daily Pivot Point R1 | 1901.86 |
| Daily Pivot Point R2 | 1938.85 |
| Daily Pivot Point R3 | 1959.06 |
[/s2If]
Join Our Telegram Group
")


