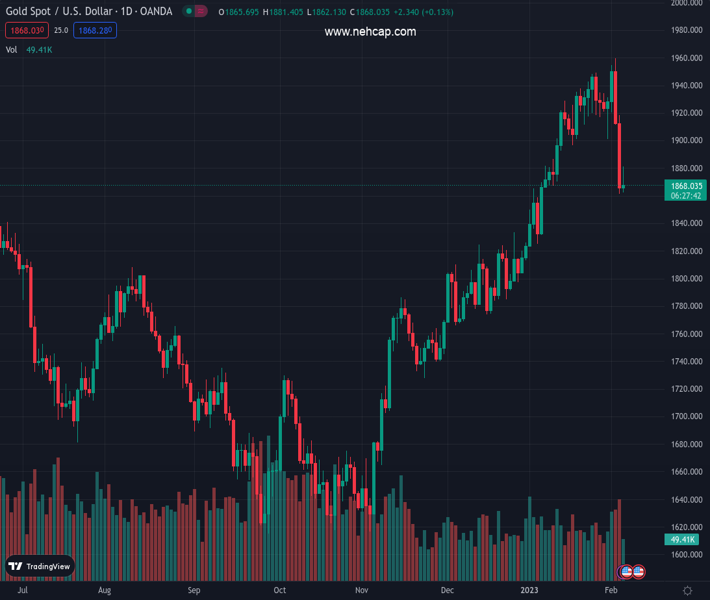
#XAUUSD @ 1,868.09 Last week’s strong US labor market report warranted further US Federal Reserve action. (Pivot Orderbook analysis)
…
This is a premium post.
[s2If !current_user_can(access_s2member_level4)]Please register for PREMIUM VERSION HERE to read full post below containing analysis. In case of any error or you think you are not able to read the full post below, please email us at support#nehcap.com [lwa][/s2If] [s2If current_user_can(access_s2member_level4)]
- Last week’s strong US labor market report warranted further US Federal Reserve action.
- Money market futures have shown 50 bps of rate hikes priced in for the May meeting.
- Gold Price Analysis: Neutral with risk skewed to the downside.
The pair currently trades last at 1868.09.
The previous day high was 1918.65 while the previous day low was 1861.45. The daily 38.2% Fib levels comes at 1883.3, expected to provide resistance. Similarly, the daily 61.8% fib level is at 1896.8, expected to provide resistance.
Gold price fall is being stopped as bulls entered the market at last Friday’s low of around $1860 and reclaimed $1870. A staggering US Nonfarm Payrolls report and markets repricing further interest rate hikes augmented demand for the greenback, a headwind for the non-yielding metal. At the time of writing, the XAU/USD exchanges hands at $1868.77, up by half of a one percentage point.
Wall Street continued to stumble after the US Department of Labor revealed that the United States (US) economy added more than 500K jobs to the economy, while the unemployment rate dropped to a 53-and-a-half-year low level of 3.4%. That reignited the spark that the US Federal Reserve (Fed) might need to raise rates, above the market’s expectations, with traders foreseeing a rate cut in the second half of 2023.
World Interest Rate Probabilities (WIRP) suggest that 50 bps are priced in for the next couple of meetings, while chances stand at 90% for the June meeting. That would take the Federal Funds target to the 5%-5.25% range, aligned with FOMC’s December dot plots.
In the meantime, the US Dollar Index, a gauge of the buck’s value vs. its peers, advances 0.50%, up at 103.519, putting a lid on Gold’s recovery, alongside the US 10-year Treasury bond yield, up nine basis points (bps) at 3.616%.
Gold trader’s focus shifted to Federal Reserve Chair Jerome Powell’s interview at the Economic Club of Washington, alongside the Trade Balance and President Joe Biden’s delivery of the State of the Union before the US Congress, on Tuesday.
Technically speaking, XAU/USD found its foot at around $1860, shy of testing the 50-day Exponential Moving Average (EMA) at $1854.87. Although the yellow metal hit a daily high of $1881.31, risks are skewed to the downside. Supporting the aforementioned is the Relative Strength Index (RSP) collapsing to bearish territory, while the Rate of Change (RoC) portrays sellers gathering momentum.
Therefore, the XAU/USD first support would be February’s 6 low at $1860.44. Break below will expose the 50-day EMA at $1854.85, followed by the 100-day EMA at 1812.85, ahead of the $1800 psychological level.
Technical Levels: Supports and Resistances
XAUUSD currently trading at 1870.38 at the time of writing. Pair opened at 1864.86 and is trading with a change of 0.3 % .
| Overview | Overview.1 | |
|---|---|---|
| 0 | Today last price | 1870.38 |
| 1 | Today Daily Change | 5.52 |
| 2 | Today Daily Change % | 0.30 |
| 3 | Today daily open | 1864.86 |
The pair is trading below its 20 Daily moving average @ 1914.36, above its 50 Daily moving average @ 1846.04 , above its 100 Daily moving average @ 1766.47 and above its 200 Daily moving average @ 1775.99
| Trends | Trends.1 | |
|---|---|---|
| 0 | Daily SMA20 | 1914.36 |
| 1 | Daily SMA50 | 1846.04 |
| 2 | Daily SMA100 | 1766.47 |
| 3 | Daily SMA200 | 1775.99 |
The previous day high was 1918.65 while the previous day low was 1861.45. The daily 38.2% Fib levels comes at 1883.3, expected to provide resistance. Similarly, the daily 61.8% fib level is at 1896.8, expected to provide resistance.
Note the levels of interest below:
- Pivot support is noted at 1844.66, 1824.45, 1787.46
- Pivot resistance is noted at 1901.86, 1938.85, 1959.06
| Levels | Levels.1 |
|---|---|
| Previous Daily High | 1918.65 |
| Previous Daily Low | 1861.45 |
| Previous Weekly High | 1959.80 |
| Previous Weekly Low | 1861.45 |
| Previous Monthly High | 1949.27 |
| Previous Monthly Low | 1823.76 |
| Daily Fibonacci 38.2% | 1883.30 |
| Daily Fibonacci 61.8% | 1896.80 |
| Daily Pivot Point S1 | 1844.66 |
| Daily Pivot Point S2 | 1824.45 |
| Daily Pivot Point S3 | 1787.46 |
| Daily Pivot Point R1 | 1901.86 |
| Daily Pivot Point R2 | 1938.85 |
| Daily Pivot Point R3 | 1959.06 |
[/s2If]
Join Our Telegram Group
")


