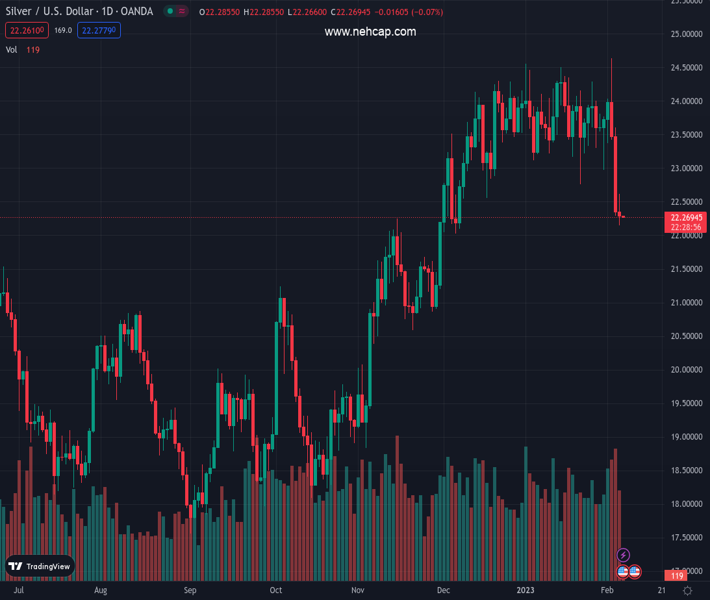
#XAGUSD @ 22.263 Silver prices break downwards from a megaphone formation, suggesting that bias is downwards. (Pivot Orderbook analysis)
…
This is a premium post.
[s2If !current_user_can(access_s2member_level4)]Please register for PREMIUM VERSION HERE to read full post below containing analysis. In case of any error or you think you are not able to read the full post below, please email us at support#nehcap.com [lwa][/s2If] [s2If current_user_can(access_s2member_level4)]
- Silver prices break downwards from a megaphone formation, suggesting that XAG/USD bias is downwards.
- Silver Price Analysis: Downward biased and will face strong resistance at around$22.29.
The pair currently trades last at 22.263.
The previous day high was 23.61 while the previous day low was 22.29. The daily 38.2% Fib levels comes at 22.79, expected to provide resistance. Similarly, the daily 61.8% fib level is at 23.1, expected to provide resistance.
Silver price slides below a downslope trendline of a megaphone formation and also beneath the 100-day Exponential Moving Average (EMA) as Tuesday’s Asian session begins. At the time of writing, the XAG/USD exchanges hands at $22.25.
From a technical perspective, the XAG/USD is neutral-to-downward biased. Silver’s fall under a megaphone trendline could exacerbate the white metal’s fall toward the 100-day EMA at $22.29. A breach of the latter and the 200-day EMA at $21.94 would be in play, which, once cleared, and XAG/USD might test the November 28 swing low at $20.87.
Given the backdrop, oscillators like the Relative Strength Index (RSI) and the Rate of Change (RoC) suggest that selling pressure is gathering momentum.
Nevertheless, as an alternate scenario, the XAG/USD first resistance would be the 100-day EMA at $22.29. Once cleared, the non-yielding metal could climb toward the 50-day EMA at $23.05, ahead of the 20-day EMA at $23.32.
Technical Levels: Supports and Resistances
XAGUSD currently trading at 22.28 at the time of writing. Pair opened at 22.35 and is trading with a change of -0.31 % .
| Overview | Overview.1 | |
|---|---|---|
| 0 | Today last price | 22.28 |
| 1 | Today Daily Change | -0.07 |
| 2 | Today Daily Change % | -0.31 |
| 3 | Today daily open | 22.35 |
The pair is trading below its 20 Daily moving average @ 23.69, below its 50 Daily moving average @ 23.42 , above its 100 Daily moving average @ 21.69 and above its 200 Daily moving average @ 21.02
| Trends | Trends.1 | |
|---|---|---|
| 0 | Daily SMA20 | 23.69 |
| 1 | Daily SMA50 | 23.42 |
| 2 | Daily SMA100 | 21.69 |
| 3 | Daily SMA200 | 21.02 |
The previous day high was 23.61 while the previous day low was 22.29. The daily 38.2% Fib levels comes at 22.79, expected to provide resistance. Similarly, the daily 61.8% fib level is at 23.1, expected to provide resistance.
Note the levels of interest below:
- Pivot support is noted at 21.89, 21.43, 20.58
- Pivot resistance is noted at 23.21, 24.06, 24.52
| Levels | Levels.1 |
|---|---|
| Previous Daily High | 23.61 |
| Previous Daily Low | 22.29 |
| Previous Weekly High | 24.64 |
| Previous Weekly Low | 22.29 |
| Previous Monthly High | 24.55 |
| Previous Monthly Low | 22.76 |
| Daily Fibonacci 38.2% | 22.79 |
| Daily Fibonacci 61.8% | 23.10 |
| Daily Pivot Point S1 | 21.89 |
| Daily Pivot Point S2 | 21.43 |
| Daily Pivot Point S3 | 20.58 |
| Daily Pivot Point R1 | 23.21 |
| Daily Pivot Point R2 | 24.06 |
| Daily Pivot Point R3 | 24.52 |
[/s2If]
Join Our Telegram Group
")


