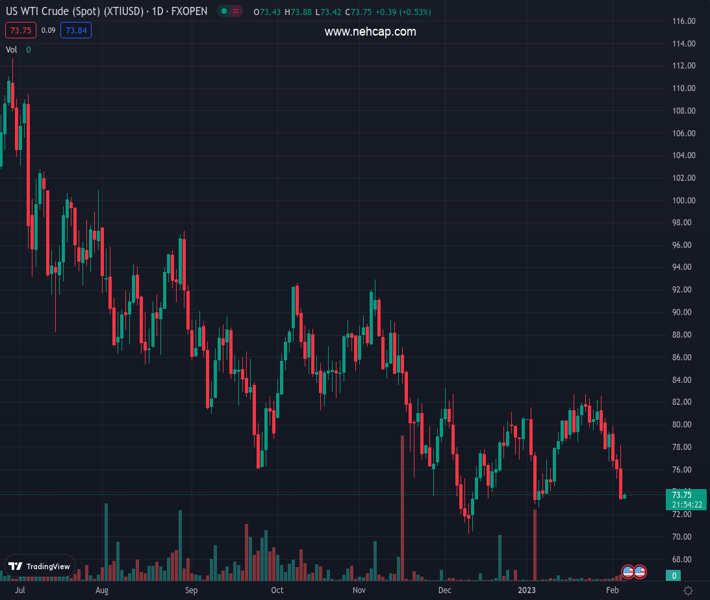
WTI is looking for an intermediate cushion after a vertical fall to near $73.00, more downside looks favored. (Pivot Orderbook analysis)
…
This is a premium post.
[s2If !current_user_can(access_s2member_level4)]Please register for PREMIUM VERSION HERE to read full post below containing analysis. In case of any error or you think you are not able to read the full post below, please email us at support#nehcap.com [lwa][/s2If] [s2If current_user_can(access_s2member_level4)]
- WTI is looking for an intermediate cushion after a vertical fall to near $73.00, more downside looks favored.
- Hawkish interest rate guidance by western central banks has weakened oil demand projections.
- The OPEC has decided to stick to current oil restrictions despite declining oil price.
The pair currently trades last at 73.76.
The previous day high was 78.18 while the previous day low was 73.36. The daily 38.2% Fib levels comes at 75.2, expected to provide resistance. Similarly, the daily 61.8% fib level is at 76.34, expected to provide resistance.
West Texas Intermediate (WTI), futures on NYMEX, is gauging an intermediate cushion after dropping to near the critical support of $73.00. The oil price witnessed a massive sell-off on Friday after a surprisingly impressive United States Nonfarm Payroll (NFP) report. And, further downside is favored as investors have underpinned the risk aversion theme as Federal Reserve (Fed) pause bets have faded for now.
According to the US NFP report, the United States economy added fresh 517K in January, extremely higher than the consensus of 185K and December’s release of 260K. While the Unemployment Rate was trimmed to a multi-decade low of 3.4% lower than the expectations and the prior release of 3.6% and 3.5% respectively.
Households in the United States are expected to be equipped with higher funds, which will trigger the overall demand in the economy. It is worth noting that Average Hourly Earnings have surprisingly dropped significantly to 4.4%. However, the impact of a decline in the labor cost index might be offset by a rise in the number of individuals employed. As negotiation power will again shift in the favor of job-seekers due to solid labor demand.
Apart from that US ISM Services PMI landed better than expectations. The economic data improved to 55.2 from the consensus of 50.4. Also, the New Orders Index indicates forward demand scaled to 60.4 vs. the projections of 57.6, which indicates that the overall demand is recovering. However, the fear of further interest rate hikes by the Fed carries higher weightage in comparison with the expression of demand recovery.
Meanwhile, an absence of further restrictions on oil output by the OPEC also strengthened oil bears. A continuous flow of oil amid weaker oil demand due to fresh interest rate hikes by the Fed, the European Central Bank (ECB), and the Bank of England (BoE) along with hawkish interest rate guidance are favoring further downside in the oil price ahead.
Technical Levels: Supports and Resistances
XTIUSD currently trading at 73.76 at the time of writing. Pair opened at 73.45 and is trading with a change of 0.42 % .
| Overview | Overview.1 | |
|---|---|---|
| 0 | Today last price | 73.76 |
| 1 | Today Daily Change | 0.31 |
| 2 | Today Daily Change % | 0.42 |
| 3 | Today daily open | 73.45 |
The pair remains strongly bearish on the daily time frame. It trades below the 20 SMA @ 78.81, 50 SMA 77.65, 100 SMA @ 81.12 and 200 SMA @ 90.77.
| Trends | Trends.1 | |
|---|---|---|
| 0 | Daily SMA20 | 78.81 |
| 1 | Daily SMA50 | 77.65 |
| 2 | Daily SMA100 | 81.12 |
| 3 | Daily SMA200 | 90.77 |
The previous day high was 78.18 while the previous day low was 73.36. The daily 38.2% Fib levels comes at 75.2, expected to provide resistance. Similarly, the daily 61.8% fib level is at 76.34, expected to provide resistance.
Note the levels of interest below:
- Pivot support is noted at 71.81, 70.17, 66.99
- Pivot resistance is noted at 76.63, 79.82, 81.45
| Levels | Levels.1 |
|---|---|
| Previous Daily High | 78.18 |
| Previous Daily Low | 73.36 |
| Previous Weekly High | 80.61 |
| Previous Weekly Low | 73.36 |
| Previous Monthly High | 82.68 |
| Previous Monthly Low | 72.64 |
| Daily Fibonacci 38.2% | 75.20 |
| Daily Fibonacci 61.8% | 76.34 |
| Daily Pivot Point S1 | 71.81 |
| Daily Pivot Point S2 | 70.17 |
| Daily Pivot Point S3 | 66.99 |
| Daily Pivot Point R1 | 76.63 |
| Daily Pivot Point R2 | 79.82 |
| Daily Pivot Point R3 | 81.45 |
[/s2If]
Join Our Telegram Group
")


