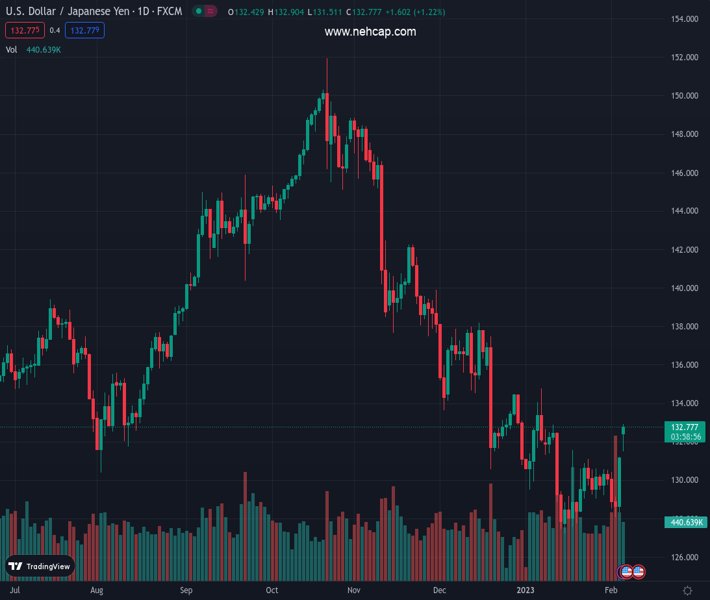
#USDJPY @ 132.776 gapped up since the Asian session by about 30 pips, reaching a daily high of 132.90. (Pivot Orderbook analysis)
…
This is a premium post.
[s2If !current_user_can(access_s2member_level4)]Please register for PREMIUM VERSION HERE to read full post below containing analysis. In case of any error or you think you are not able to read the full post below, please email us at support#nehcap.com [lwa][/s2If] [s2If current_user_can(access_s2member_level4)]
- USD/JPY gapped up since the Asian session by about 30 pips, reaching a daily high of 132.90.
- USD/JPY Price Analysis: Neutral biased, but tilted upwards, with bulls eyeing 133.00.
The pair currently trades last at 132.776.
The previous day high was 131.2 while the previous day low was 128.33. The daily 38.2% Fib levels comes at 130.1, expected to provide support. Similarly, the daily 61.8% fib level is at 129.42, expected to provide support.
The USD/JPY gapped toward new 5-week highs shy of the 50-day Exponential Moving Average (EMA) by just two pips at 132.89 and remained nearby, about to challenge the 133.00 psychological price level. The last US jobs report crushed estimates, bolstering the US Dollar (USD) on speculations for further Federal Reserve’s (Fed) aggression. Therefore, the USD/JPY rallied 3.45% since Friday and exchanged hands at 132.79 after hitting a low of 131.51.
The USD/JPY shifted neutral biased after gapping up from around 131.20 to current exchange rates. On its way up, the major reclaimed the 20-day Exponential Moving Average (EMA) at 130.53, and it’s poised to crack the 50-day EMA at 132.91, ahead of the 133.00 figure.
With the Relative Strength Index (RSI) and the Rate of Change (RoC), oscillators shifted bullish, opening the door for further upside. However, it should be said that the USD/JPY would face the trend-setter 200-day EMA at 133.88, which, once cleared, would pave the way to test the 100-day EMA above the 135.00 figure.
As an alternate scenario, the USD/JPY first support would be 132.00. A breach of the latter and the USD/JPY could test the day’s low at 131.51, followed by last Friday’s high at 131.20. Once those demand zones are broken, it would expose the 20-day EMA at 130.29.
Technical Levels: Supports and Resistances
USDJPY currently trading at 132.88 at the time of writing. Pair opened at 131.15 and is trading with a change of 1.32 % .
| Overview | Overview.1 | |
|---|---|---|
| 0 | Today last price | 132.88 |
| 1 | Today Daily Change | 1.73 |
| 2 | Today Daily Change % | 1.32 |
| 3 | Today daily open | 131.15 |
The pair is trading above its 20 Daily moving average @ 129.86, above its 50 Daily moving average @ 132.81 , below its 100 Daily moving average @ 138.79 and below its 200 Daily moving average @ 136.79
| Trends | Trends.1 | |
|---|---|---|
| 0 | Daily SMA20 | 129.86 |
| 1 | Daily SMA50 | 132.81 |
| 2 | Daily SMA100 | 138.79 |
| 3 | Daily SMA200 | 136.79 |
The previous day high was 131.2 while the previous day low was 128.33. The daily 38.2% Fib levels comes at 130.1, expected to provide support. Similarly, the daily 61.8% fib level is at 129.42, expected to provide support.
Note the levels of interest below:
- Pivot support is noted at 129.25, 127.35, 126.38
- Pivot resistance is noted at 132.12, 133.09, 134.99
| Levels | Levels.1 |
|---|---|
| Previous Daily High | 131.20 |
| Previous Daily Low | 128.33 |
| Previous Weekly High | 131.20 |
| Previous Weekly Low | 128.08 |
| Previous Monthly High | 134.78 |
| Previous Monthly Low | 127.22 |
| Daily Fibonacci 38.2% | 130.10 |
| Daily Fibonacci 61.8% | 129.42 |
| Daily Pivot Point S1 | 129.25 |
| Daily Pivot Point S2 | 127.35 |
| Daily Pivot Point S3 | 126.38 |
| Daily Pivot Point R1 | 132.12 |
| Daily Pivot Point R2 | 133.09 |
| Daily Pivot Point R3 | 134.99 |
[/s2If]
Join Our Telegram Group
")


