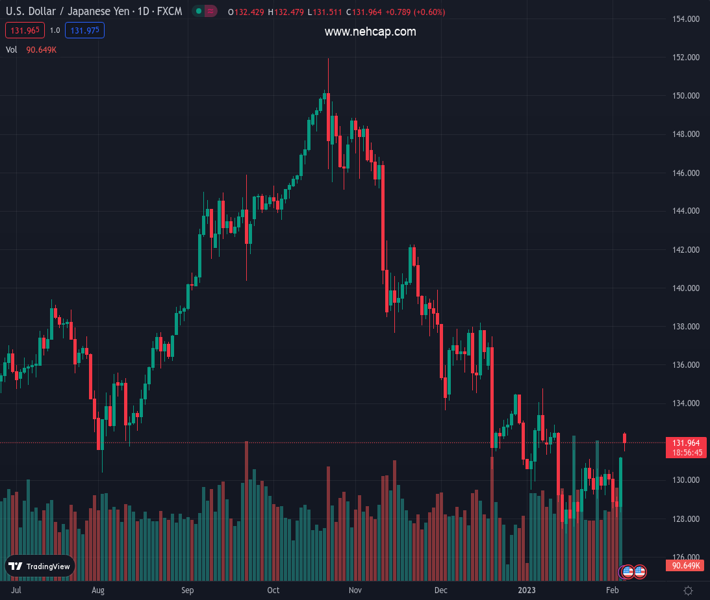
#USDJPY @ 132.065 grinds higher around three-week top during two-day uptrend., @nehcap view: Further upside expected (Pivot Orderbook analysis)
…
This is a premium post.
[s2If !current_user_can(access_s2member_level4)]Please register for PREMIUM VERSION HERE to read full post below containing analysis. In case of any error or you think you are not able to read the full post below, please email us at support#nehcap.com [lwa][/s2If] [s2If current_user_can(access_s2member_level4)]
- USD/JPY grinds higher around three-week top during two-day uptrend.
- Successful break of 130.00 support-confluence join firmer oscillators to favor bulls.
- 50-DMA challenges immediate upside ahead of January’s peak.
The pair currently trades last at 132.065.
The previous day high was 131.2 while the previous day low was 128.33. The daily 38.2% Fib levels comes at 130.1, expected to provide support. Similarly, the daily 61.8% fib level is at 129.42, expected to provide support.
USD/JPY remains firmer as buyers keep the reins at the highest levels in three weeks during early Monday. In doing so, the Yen pair also justifies the previous day’s upside break of the key 130.00 hurdle, now support, while portraying a two-day uptrend. That said, the Yen pair trades around 132.30 by the press time.
In addition to the upside break of the previous resistance line from late November 2022 and the 21-DMA, bullish MACD signals and upbeat RSI (14), not overbought, also keep the USD/JPY buyers hopeful.
However, the 50-DMA hurdle surrounding 132.70 presently challenges the USD/JPY bulls. Also acting as an upside filter is the previous monthly peak of around 134.80.
It should be noted that a clear upside break of 134.80 could convince buyers to retake control and reverse the downtrend from early November.
On the flip side, the aforementioned resistance-turned-support confluence near the 130.00 psychological magnet puts a floor under the USD/JPY prices.
Following that, an ascending trend line from mid-January will challenge the USD/JPY sellers around 128.20.
If at all the USD/JPY bears manage to conquer the 128.20 support bottom surrounding 127.20 and May 2022 low near 126.35 could probe them before highlighting the 120.00 round figure.
Overall, USD/JPY is likely to extend the latest recovery but a clear upside break of the 50-DMA becomes necessary for the buyer’s welcome.
Trend: Further upside expected
Technical Levels: Supports and Resistances
USDJPY currently trading at 132.26 at the time of writing. Pair opened at 131.15 and is trading with a change of 0.85% % .
| Overview | Overview.1 | |
|---|---|---|
| 0 | Today last price | 132.26 |
| 1 | Today Daily Change | 1.11 |
| 2 | Today Daily Change % | 0.85% |
| 3 | Today daily open | 131.15 |
The pair is trading above its 20 Daily moving average @ 129.86, below its 50 Daily moving average @ 132.81 , below its 100 Daily moving average @ 138.79 and below its 200 Daily moving average @ 136.79
| Trends | Trends.1 | |
|---|---|---|
| 0 | Daily SMA20 | 129.86 |
| 1 | Daily SMA50 | 132.81 |
| 2 | Daily SMA100 | 138.79 |
| 3 | Daily SMA200 | 136.79 |
The previous day high was 131.2 while the previous day low was 128.33. The daily 38.2% Fib levels comes at 130.1, expected to provide support. Similarly, the daily 61.8% fib level is at 129.42, expected to provide support.
Note the levels of interest below:
- Pivot support is noted at 129.25, 127.35, 126.38
- Pivot resistance is noted at 132.12, 133.09, 134.99
| Levels | Levels.1 |
|---|---|
| Previous Daily High | 131.20 |
| Previous Daily Low | 128.33 |
| Previous Weekly High | 131.20 |
| Previous Weekly Low | 128.08 |
| Previous Monthly High | 134.78 |
| Previous Monthly Low | 127.22 |
| Daily Fibonacci 38.2% | 130.10 |
| Daily Fibonacci 61.8% | 129.42 |
| Daily Pivot Point S1 | 129.25 |
| Daily Pivot Point S2 | 127.35 |
| Daily Pivot Point S3 | 126.38 |
| Daily Pivot Point R1 | 132.12 |
| Daily Pivot Point R2 | 133.09 |
| Daily Pivot Point R3 | 134.99 |
[/s2If]
Join Our Telegram Group
")


