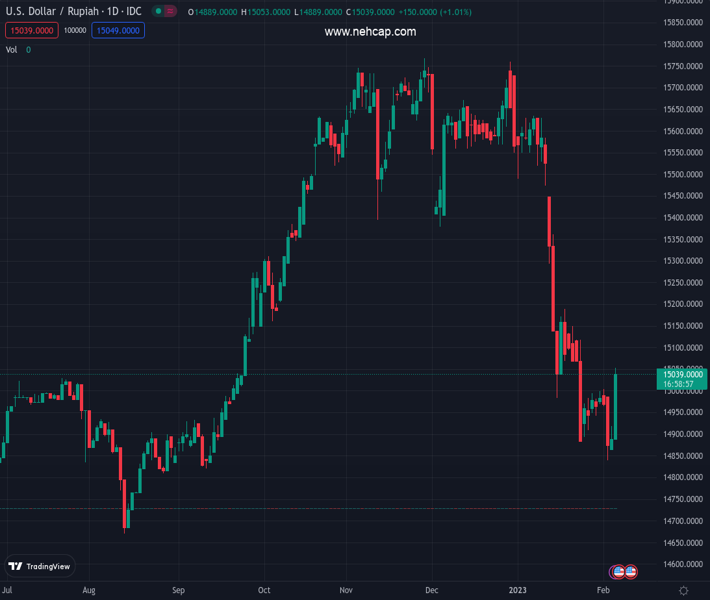
#USDIDR @ 15,040.0 retreat from intraday high on upbeat Indonesia Q4 GDP. (Pivot Orderbook analysis)
…
This is a premium post.
[s2If !current_user_can(access_s2member_level4)]Please register for PREMIUM VERSION HERE to read full post below containing analysis. In case of any error or you think you are not able to read the full post below, please email us at support#nehcap.com [lwa][/s2If] [s2If current_user_can(access_s2member_level4)]
- USD/IDR retreat from intraday high on upbeat Indonesia Q4 GDP.
- Indonesia GDP rose 0.36% QoQ in Q4 versus 0.33% expected and 1.81% prior.
- China-linked risk aversion, Fed concerns put a floor under the USD/IDR prices.
The pair currently trades last at 15040.0.
The previous day high was 15098.0 while the previous day low was 14868.0. The daily 38.2% Fib levels comes at 15010.14, expected to provide support. Similarly, the daily 61.8% fib level is at 14955.86, expected to provide support.
USD/IDR fades the week-start rebound as it drops to $15,050 after Indonesia reported the fourth quarter (Q4) Gross Domestic Product (GDP) data. It’s worth noting, however, that the risk-off mood challenges the Indonesian Rupiah (IDR) buyers.
Indonesia’s Q4 GDP marked 0.36% QoQ and 5.01% YoY growth during Q4. In doing so, the growth figures are better than the 0.33% and 4.84% market forecasts but stayed below the 1.81% and 5.72% previous releases.
“Southeast Asia’s largest economy expanded 5.31% in 2022, Statistics Indonesia data showed, its best annual growth rate in nine years,” said Reuters following the Indonesia GDP release.
Talking about the risks, The weekend headlines suggesting the US military fighter jet shot down a suspected Chinese spy balloon off the coast of South Carolina join the recently hawkish concerns surrounding the US Federal Reserve (Fed) to weigh on sentiment.
Following the US shooting of the China balloon, US Secretary of State Antony Blinked called off his previously planned visit to Beijing. In a reaction to the event, China President Xi Jinping termed this as an ‘obvious overreaction’ while also warning to not aggravate the tense situation.
Elsewhere, the hawkish Fed better gained new life after Friday’s upbeat US jobs report and activity numbers, which in turn underpinned the recovery in the US Treasury bond yields. Also likely to probe the sentiment could be the cautious mood ahead of Fed Chairman Jerome Powell’s speech on Tuesday, as well as the market’s chatters that China’s stimulus will be limited.
Against this backdrop, the MSCI’s index of Asia-Pacific shares ex-Japan slumps 2.0% whereas Indonesia’s IDX Composite drops half a percent by the press time.
Looking forward, risk catalysts will be crucial ahead of Tuesday’s Fed Chair Jerome Powell’s speech. Following that, Friday’s US UoM Consumer Sentiment Index for February, as well as the University of Michigan’s 5-year Consumer Inflation expectations, should be eyed for clear directions.
Unless providing a daily closing beyond the 200-DMA, around $15,135 by the press time, the USD/IDR bulls are off the table.
Technical Levels: Supports and Resistances
USDIDR currently trading at 15044.15 at the time of writing. Pair opened at 15094.8 and is trading with a change of -0.34% % .
| Overview | Overview.1 | |
|---|---|---|
| 0 | Today last price | 15044.15 |
| 1 | Today Daily Change | -50.6500 |
| 2 | Today Daily Change % | -0.34% |
| 3 | Today daily open | 15094.8 |
The pair remains strongly bearish on the daily time frame. It trades below the 20 SMA @ 15116.6975, 50 SMA 15406.879, 100 SMA @ 15427.911 and 200 SMA @ 15108.1235.
| Trends | Trends.1 | |
|---|---|---|
| 0 | Daily SMA20 | 15116.6975 |
| 1 | Daily SMA50 | 15406.8790 |
| 2 | Daily SMA100 | 15427.9110 |
| 3 | Daily SMA200 | 15108.1235 |
The previous day high was 15098.0 while the previous day low was 14868.0. The daily 38.2% Fib levels comes at 15010.14, expected to provide support. Similarly, the daily 61.8% fib level is at 14955.86, expected to provide support.
Note the levels of interest below:
- Pivot support is noted at 14942.5333, 14790.2667, 14712.5333
- Pivot resistance is noted at 15172.5333, 15250.2667, 15402.5333
| Levels | Levels.1 |
|---|---|
| Previous Daily High | 15098.0000 |
| Previous Daily Low | 14868.0000 |
| Previous Weekly High | 15098.0000 |
| Previous Weekly Low | 14835.0000 |
| Previous Monthly High | 15700.6000 |
| Previous Monthly Low | 14862.0500 |
| Daily Fibonacci 38.2% | 15010.1400 |
| Daily Fibonacci 61.8% | 14955.8600 |
| Daily Pivot Point S1 | 14942.5333 |
| Daily Pivot Point S2 | 14790.2667 |
| Daily Pivot Point S3 | 14712.5333 |
| Daily Pivot Point R1 | 15172.5333 |
| Daily Pivot Point R2 | 15250.2667 |
| Daily Pivot Point R3 | 15402.5333 |
[/s2If]
Join Our Telegram Group
")


