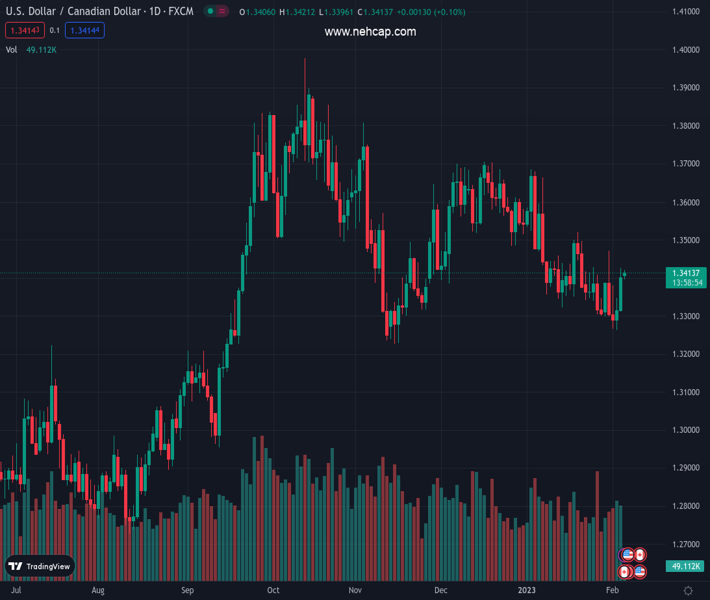
#USDCAD @ 1.34146 struggles to capitalize on a modest bullish gap opening on Monday. (Pivot Orderbook analysis)
…
This is a premium post.
[s2If !current_user_can(access_s2member_level4)]Please register for PREMIUM VERSION HERE to read full post below containing analysis. In case of any error or you think you are not able to read the full post below, please email us at support#nehcap.com [lwa][/s2If] [s2If current_user_can(access_s2member_level4)]
- USD/CAD struggles to capitalize on a modest bullish gap opening on Monday.
- An uptick in crude oil prices underpins the Loonie and acts as a headwind.
- A combination of factors continues to benefit the USD and lends support.
The pair currently trades last at 1.34146.
The previous day high was 1.3427 while the previous day low was 1.3308. The daily 38.2% Fib levels comes at 1.3381, expected to provide support. Similarly, the daily 61.8% fib level is at 1.3353, expected to provide support.
The USD/CAD pair fills the modest bullish gap opening on Monday and retreats to the 1.3400 mark during the early part of the European session.
Crude oil prices edge higher and recover a part of Friday’s slide to over a one-month low, which, in turn, is seen underpinning the commodity-linked Loonie and acting as a headwind for the USD/CAD pair. The downside, however, remains cushioned amid strong follow-through US Dollar buying interest.
In fact, the USD Index, which tracks the greenback against a basket of currencies, builds on Friday’s solid recovery from a nine-month low and continues to draw support from a combination of factors. The upbeat US jobs data could allow the Fed to stick to its hawkish stance and keep raising rates.
The expectations push the US Treasury bond yields higher, which, along with the risk-off environment, is seen benefitting the safe-haven greenback. This, in turn, suggests that the path of least resistance for the USD/CAD pair is to the upside and any meaningful slide is likely to get bought into.
There isn’t any major market-moving economic data due for release from the US on Monday, leaving the USD at the mercy of the US bond yields and the broader market risk sentiment. Apart from this, traders will take cues from oil price dynamics to grab short-term opportunities around the USD/CAD pair.
Technical Levels: Supports and Resistances
USDCAD currently trading at 1.3405 at the time of writing. Pair opened at 1.3401 and is trading with a change of 0.03 % .
| Overview | Overview.1 | |
|---|---|---|
| 0 | Today last price | 1.3405 |
| 1 | Today Daily Change | 0.0004 |
| 2 | Today Daily Change % | 0.0300 |
| 3 | Today daily open | 1.3401 |
The pair is trading above its 20 Daily moving average @ 1.338, below its 50 Daily moving average @ 1.3499 , below its 100 Daily moving average @ 1.3534 and above its 200 Daily moving average @ 1.3222
| Trends | Trends.1 | |
|---|---|---|
| 0 | Daily SMA20 | 1.3380 |
| 1 | Daily SMA50 | 1.3499 |
| 2 | Daily SMA100 | 1.3534 |
| 3 | Daily SMA200 | 1.3222 |
The previous day high was 1.3427 while the previous day low was 1.3308. The daily 38.2% Fib levels comes at 1.3381, expected to provide support. Similarly, the daily 61.8% fib level is at 1.3353, expected to provide support.
Note the levels of interest below:
- Pivot support is noted at 1.333, 1.326, 1.3211
- Pivot resistance is noted at 1.3449, 1.3498, 1.3568
| Levels | Levels.1 |
|---|---|
| Previous Daily High | 1.3427 |
| Previous Daily Low | 1.3308 |
| Previous Weekly High | 1.3472 |
| Previous Weekly Low | 1.3262 |
| Previous Monthly High | 1.3685 |
| Previous Monthly Low | 1.3300 |
| Daily Fibonacci 38.2% | 1.3381 |
| Daily Fibonacci 61.8% | 1.3353 |
| Daily Pivot Point S1 | 1.3330 |
| Daily Pivot Point S2 | 1.3260 |
| Daily Pivot Point S3 | 1.3211 |
| Daily Pivot Point R1 | 1.3449 |
| Daily Pivot Point R2 | 1.3498 |
| Daily Pivot Point R3 | 1.3568 |
[/s2If]
Join Our Telegram Group
")


