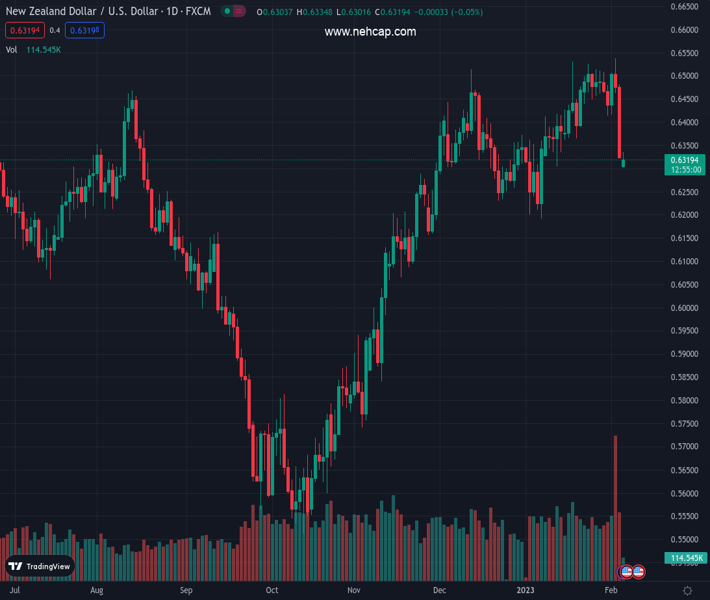
#NZDUSD @ 0.63185 stages a modest recovery from a one-month low, though lacks follow-through buying. (Pivot Orderbook analysis)
…
This is a premium post.
[s2If !current_user_can(access_s2member_level4)]Please register for PREMIUM VERSION HERE to read full post below containing analysis. In case of any error or you think you are not able to read the full post below, please email us at support#nehcap.com [lwa][/s2If] [s2If current_user_can(access_s2member_level4)]
- NZD/USD stages a modest recovery from a one-month low, though lacks follow-through buying.
- A stronger USD, along with the risk-off environment, acts as a headwind for the risk-sensitive Kiwi.
- The fundamental backdrop supports prospects for an extension of the recent decline for the pair.
The pair currently trades last at 0.63185.
The previous day high was 0.6485 while the previous day low was 0.6322. The daily 38.2% Fib levels comes at 0.6384, expected to provide resistance. Similarly, the daily 61.8% fib level is at 0.6423, expected to provide resistance.
The NZD/USD pair finds some support near the 0.6300 mark and rebounds a few pips from a one-month low touched earlier this Monday. Spot prices, however, struggle to capitalize on the move and remain vulnerable to extend the recent sharp pullback from the highest level since June 2022 touched last week.
A combination of factors assists the US Dollar to build on Friday’s strong recovery from a nine-month low and caps the upside for the NZD/USD pair. The upbeat US monthly jobs report forced investors to scale back their expectations for an imminent pause in the Fed’s policy-tightening cycle. This, along with the prevalent risk-off environment, further underpins the safe-haven buck and acts as a headwind for the risk-sensitive Kiwi.
The headline NFP print surpassed even the most optimistic estimates and showed that the US economy added 517K new jobs in January. Furthermore, the unemployment rate unexpectedly dipped to 3.4% during the reported month and pointed to the underlying strength in the US labor market. This could allow the Fed to keep raising interest rates, which, in turn, pushes the US Treasury bond yields higher and continues to benefit the greenback.
Meanwhile, expectations that the US central bank will stick to its hawkish stance for longer fuel concerns about economic headwinds stemming from the continuous rise in borrowing costs. Adding to this, unimpressive quarterly earnings reports from tech companies leads to a further decline in the equity markets. The fundamental backdrop seems tilted firmly in favour of the USD bulls and supports prospects for additional losses for the NZD/USD pair.
There isn’t any major market-moving economic data due for release from the US on Monday, leaving the greenback at the mercy of the US bond yields. Apart from this, the broader risk sentiment might influence the USD price dynamics and contribute to producing short-term trading opportunities around the NZD/USD pair.
Technical Levels: Supports and Resistances
NZDUSD currently trading at 0.6312 at the time of writing. Pair opened at 0.6324 and is trading with a change of -0.19 % .
| Overview | Overview.1 | |
|---|---|---|
| 0 | Today last price | 0.6312 |
| 1 | Today Daily Change | -0.0012 |
| 2 | Today Daily Change % | -0.1900 |
| 3 | Today daily open | 0.6324 |
The pair is trading below its 20 Daily moving average @ 0.6434, below its 50 Daily moving average @ 0.637 , above its 100 Daily moving average @ 0.6107 and above its 200 Daily moving average @ 0.6191
| Trends | Trends.1 | |
|---|---|---|
| 0 | Daily SMA20 | 0.6434 |
| 1 | Daily SMA50 | 0.6370 |
| 2 | Daily SMA100 | 0.6107 |
| 3 | Daily SMA200 | 0.6191 |
The previous day high was 0.6485 while the previous day low was 0.6322. The daily 38.2% Fib levels comes at 0.6384, expected to provide resistance. Similarly, the daily 61.8% fib level is at 0.6423, expected to provide resistance.
Note the levels of interest below:
- Pivot support is noted at 0.6269, 0.6214, 0.6106
- Pivot resistance is noted at 0.6432, 0.654, 0.6595
| Levels | Levels.1 |
|---|---|
| Previous Daily High | 0.6485 |
| Previous Daily Low | 0.6322 |
| Previous Weekly High | 0.6538 |
| Previous Weekly Low | 0.6322 |
| Previous Monthly High | 0.6531 |
| Previous Monthly Low | 0.6190 |
| Daily Fibonacci 38.2% | 0.6384 |
| Daily Fibonacci 61.8% | 0.6423 |
| Daily Pivot Point S1 | 0.6269 |
| Daily Pivot Point S2 | 0.6214 |
| Daily Pivot Point S3 | 0.6106 |
| Daily Pivot Point R1 | 0.6432 |
| Daily Pivot Point R2 | 0.6540 |
| Daily Pivot Point R3 | 0.6595 |
[/s2If]
Join Our Telegram Group
")


