#GBPJPY @ 159.285 extends Friday’s recovery moves to attack short-term key resistances., @nehcap view: Further upside expected (Pivot Orderbook analysis)
…
This is a premium post.
[s2If !current_user_can(access_s2member_level4)]Please register for PREMIUM VERSION HERE to read full post below containing analysis. In case of any error or you think you are not able to read the full post below, please email us at support#nehcap.com [lwa][/s2If] [s2If current_user_can(access_s2member_level4)]
- GBP/JPY extends Friday’s recovery moves to attack short-term key resistances.
- One-week-old descending trend line precedes key SMAs to challenge bulls.
- Upbeat MACD signals, U-turn from monthly support line keeps buyers hopeful.
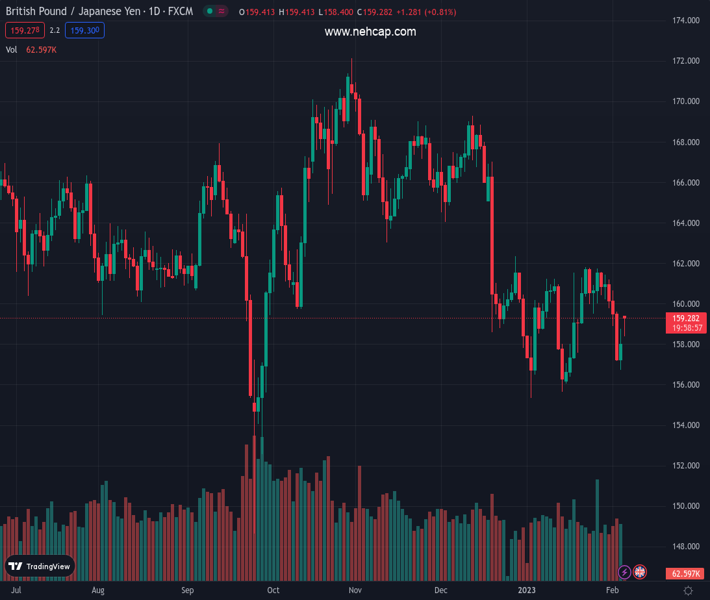
The pair currently trades last at 159.285.
The previous day high was 158.75 while the previous day low was 156.73. The daily 38.2% Fib levels comes at 157.98, expected to provide support. Similarly, the daily 61.8% fib level is at 157.5, expected to provide support.
GBP/JPY remains firmer around 159.20 as it stretches the previous day’s rebound from a three-week low during early Monday. In doing so, the cross-currency pair also jostles with the short-term key hurdles to keep the reins.
That said, bullish MACD signals join the quote’s sustained bounce off an upward-sloping support line from early January, around 156.75 by the press tie, to keep the GBP/JPY buyers hopeful.
It’s worth noting that the weekly resistance line appears the immediate hurdle for the GBP/JPY bulls to cross, near 159.30 at the latest. Following that, the 100-bar Simple Moving Average (SMA) and the 200-SMA could challenge the pair buyers around 159.40 and 159.50 respectively.
It should be observed that the 160.00 psychological magnet may act as an extra filter towards the north before directing the GBP/JPY upside to the previous monthly peak near 161.85.
Meanwhile, pullback moves could aim for the January 19 swing low surrounding 157.60 before challenging the aforementioned support line close to 156.75.
In a case where GBP/JPY bears keep the reins past 156.75, the mid-January low and the yearly bottom, respectively around 155.65 and 155.35, could test the bears.
To sum up, GBP/JPY is likely to regain the buyer’s confidence but the upside break of 159.50 appears necessary.
Trend: Further upside expected
Technical Levels: Supports and Resistances
GBPJPY currently trading at 159.15 at the time of writing. Pair opened at 158.03 and is trading with a change of 0.71% % .
| Overview | Overview.1 | |
|---|---|---|
| 0 | Today last price | 159.15 |
| 1 | Today Daily Change | 1.12 |
| 2 | Today Daily Change % | 0.71% |
| 3 | Today daily open | 158.03 |
The pair remains strongly bearish on the daily time frame. It trades below the 20 SMA @ 159.57, 50 SMA 161.88, 100 SMA @ 163.55 and 200 SMA @ 163.31.
| Trends | Trends.1 | |
|---|---|---|
| 0 | Daily SMA20 | 159.57 |
| 1 | Daily SMA50 | 161.88 |
| 2 | Daily SMA100 | 163.55 |
| 3 | Daily SMA200 | 163.31 |
The previous day high was 158.75 while the previous day low was 156.73. The daily 38.2% Fib levels comes at 157.98, expected to provide support. Similarly, the daily 61.8% fib level is at 157.5, expected to provide support.
Note the levels of interest below:
- Pivot support is noted at 156.93, 155.82, 154.9
- Pivot resistance is noted at 158.95, 159.86, 160.97
| Levels | Levels.1 |
|---|---|
| Previous Daily High | 158.75 |
| Previous Daily Low | 156.73 |
| Previous Weekly High | 161.43 |
| Previous Weekly Low | 156.73 |
| Previous Monthly High | 161.85 |
| Previous Monthly Low | 155.36 |
| Daily Fibonacci 38.2% | 157.98 |
| Daily Fibonacci 61.8% | 157.50 |
| Daily Pivot Point S1 | 156.93 |
| Daily Pivot Point S2 | 155.82 |
| Daily Pivot Point S3 | 154.90 |
| Daily Pivot Point R1 | 158.95 |
| Daily Pivot Point R2 | 159.86 |
| Daily Pivot Point R3 | 160.97 |
[/s2If]
Join Our Telegram Group
")


