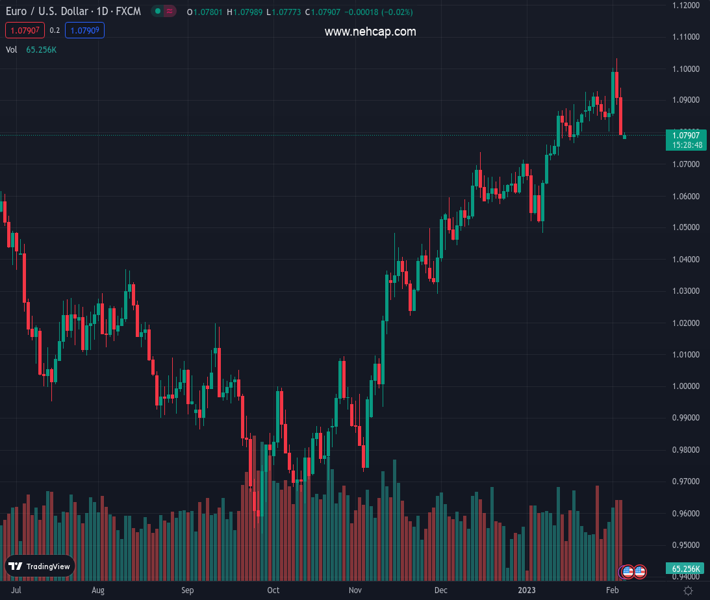
#EURUSD @ 1.07903 struggles for clear directions inside immediate bearish channel., @nehcap view: Limited recovery expected (Pivot Orderbook analysis)
…
This is a premium post.
[s2If !current_user_can(access_s2member_level4)]Please register for PREMIUM VERSION HERE to read full post below containing analysis. In case of any error or you think you are not able to read the full post below, please email us at support#nehcap.com [lwa][/s2If] [s2If current_user_can(access_s2member_level4)]
- EUR/USD struggles for clear directions inside immediate bearish channel.
- Oversold RSI, recent Doji candlestick keeps buyers hopeful.
- Convergence of 200-SMA, 50% Fibonacci retracement appears tough nut to crack for bears.
The pair currently trades last at 1.07903.
The previous day high was 1.094 while the previous day low was 1.0793. The daily 38.2% Fib levels comes at 1.0849, expected to provide resistance. Similarly, the daily 61.8% fib level is at 1.0884, expected to provide resistance.
EUR/USD seesaws near 1.0800 as bulls and bears jostle during a sluggish Monday morning in Europe. In doing so, the major currency pair struggles to justify the recent Doji candlestick inside a three-day-old bearish channel.
That said, bearish MACD signals also tease EUR/USD sellers but a convergence of the 200-SMA, lower line of the stated channel and the 50% Fibonacci retracement level of January-February upside, near 1.0760, restricts the short-term downside of the pair.
In a case where EUR/USD remains bearish past 1.0760, the 61.8% Fibonacci retracement level, also known as the “golden level”, could act as the last defense of the pair buyers around 1.0690.
Should the quote drops below 1.0690, the odds of its slump to the previous monthly low of 1.0483 can’t be ruled out.
Alternatively, recovery moves could aim for the 38.2% Fibonacci retracement level surrounding 1.0825.
However, the upside momentum remains elusive unless the quote stays inside the aforementioned bearish channel, currently between 1.0760 and 1.0890.
In a case where EUR/USD defies the bearish channel formation, Friday’s peak of 1.0930 and the monthly high surrounding 1.1033 may entertain the bulls.
To sum up, EUR/USD stays on the buyer’s radar unless it breaks the 1.0760 support confluence.
Trend: Limited recovery expected
Technical Levels: Supports and Resistances
EURUSD currently trading at 1.0793 at the time of writing. Pair opened at 1.0793 and is trading with a change of 0.00% % .
| Overview | Overview.1 | |
|---|---|---|
| 0 | Today last price | 1.0793 |
| 1 | Today Daily Change | 0.0000 |
| 2 | Today Daily Change % | 0.00% |
| 3 | Today daily open | 1.0793 |
The pair is trading below its 20 Daily moving average @ 1.0842, above its 50 Daily moving average @ 1.0677 , above its 100 Daily moving average @ 1.032 and above its 200 Daily moving average @ 1.0319
| Trends | Trends.1 | |
|---|---|---|
| 0 | Daily SMA20 | 1.0842 |
| 1 | Daily SMA50 | 1.0677 |
| 2 | Daily SMA100 | 1.0320 |
| 3 | Daily SMA200 | 1.0319 |
The previous day high was 1.094 while the previous day low was 1.0793. The daily 38.2% Fib levels comes at 1.0849, expected to provide resistance. Similarly, the daily 61.8% fib level is at 1.0884, expected to provide resistance.
Note the levels of interest below:
- Pivot support is noted at 1.0744, 1.0695, 1.0597
- Pivot resistance is noted at 1.0891, 1.0989, 1.1038
| Levels | Levels.1 |
|---|---|
| Previous Daily High | 1.0940 |
| Previous Daily Low | 1.0793 |
| Previous Weekly High | 1.1033 |
| Previous Weekly Low | 1.0793 |
| Previous Monthly High | 1.0930 |
| Previous Monthly Low | 1.0483 |
| Daily Fibonacci 38.2% | 1.0849 |
| Daily Fibonacci 61.8% | 1.0884 |
| Daily Pivot Point S1 | 1.0744 |
| Daily Pivot Point S2 | 1.0695 |
| Daily Pivot Point S3 | 1.0597 |
| Daily Pivot Point R1 | 1.0891 |
| Daily Pivot Point R2 | 1.0989 |
| Daily Pivot Point R3 | 1.1038 |
[/s2If]
Join Our Telegram Group
")


