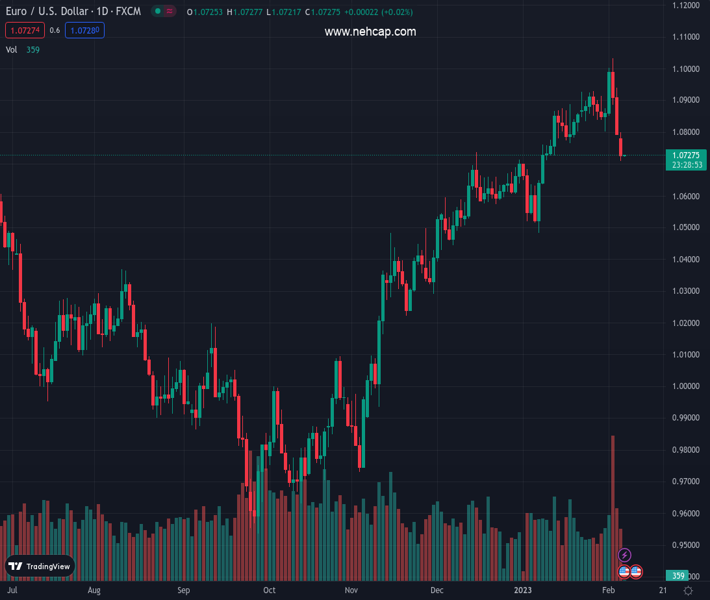
#EURUSD @ 1.07275 holds lower grounds at one-month bottom, steadies after three-day downtrend., @nehcap view: Further downside expected (Pivot Orderbook analysis)
…
This is a premium post.
[s2If !current_user_can(access_s2member_level4)]Please register for PREMIUM VERSION HERE to read full post below containing analysis. In case of any error or you think you are not able to read the full post below, please email us at support#nehcap.com [lwa][/s2If] [s2If current_user_can(access_s2member_level4)]
- EUR/USD holds lower grounds at one-month bottom, steadies after three-day downtrend.
- Downbeat MACD signals, RSI (14) join trend line breakdown to favor sellers.
- Three-month-old ascending trend line adds to the downside filters.
- Buyers need validation from 1.0930 to retake control.
The pair currently trades last at 1.07275.
The previous day high was 1.094 while the previous day low was 1.0793. The daily 38.2% Fib levels comes at 1.0849, expected to provide resistance. Similarly, the daily 61.8% fib level is at 1.0884, expected to provide resistance.
EUR/USD licks its wounds at the lowest levels in a month, depressed around 1.0725 during early Tuesday in Asia. That said, the major currency pair dropped during the last consecutive three days.
Not only the three-day downtrend but the quote’s sustained downside break of an ascending trend line from early November join the bearish MACD signals and the downbeat RSI (14), not oversold, to keep sellers hopeful.
As a result, the EUR/USD pair’s further downside towards the 50-DMA, around 1.0690, appears imminent.
However, a three-month-long upward-sloping trend line, close to 1.0655 could challenge the EUR/USD bears afterward.
In a case where the EUR/USD pairs remain bearish past 1.0655, the previous monthly low near 1.0480 and the 200-DMA level surrounding 1.0320 will gain the market’s attention.
Alternatively, recovery remains elusive unless the quote stays below the support-turned-resistance line, around 1.0850.
Even so, multiple tops marked around 1.0930 appears more important as the validation point for the EUR/USD buyers.
Following that, a run-up towards the 1.1000 psychological magnet and then refreshing the monthly high, currently around 1.1030, can’t be ruled out.
Overall, EUR/USD is likely to remain bearish with the 50-DMA and ascending trend line from November 11 acting as immediate support to watch.
Trend: Further downside expected
Technical Levels: Supports and Resistances
EURUSD currently trading at 1.0726 at the time of writing. Pair opened at 1.0793 and is trading with a change of -0.62% % .
| Overview | Overview.1 | |
|---|---|---|
| 0 | Today last price | 1.0726 |
| 1 | Today Daily Change | -0.0067 |
| 2 | Today Daily Change % | -0.62% |
| 3 | Today daily open | 1.0793 |
The pair is trading below its 20 Daily moving average @ 1.0842, above its 50 Daily moving average @ 1.0677 , above its 100 Daily moving average @ 1.032 and above its 200 Daily moving average @ 1.0319
| Trends | Trends.1 | |
|---|---|---|
| 0 | Daily SMA20 | 1.0842 |
| 1 | Daily SMA50 | 1.0677 |
| 2 | Daily SMA100 | 1.0320 |
| 3 | Daily SMA200 | 1.0319 |
The previous day high was 1.094 while the previous day low was 1.0793. The daily 38.2% Fib levels comes at 1.0849, expected to provide resistance. Similarly, the daily 61.8% fib level is at 1.0884, expected to provide resistance.
Note the levels of interest below:
- Pivot support is noted at 1.0744, 1.0695, 1.0597
- Pivot resistance is noted at 1.0891, 1.0989, 1.1038
| Levels | Levels.1 |
|---|---|
| Previous Daily High | 1.0940 |
| Previous Daily Low | 1.0793 |
| Previous Weekly High | 1.1033 |
| Previous Weekly Low | 1.0793 |
| Previous Monthly High | 1.0930 |
| Previous Monthly Low | 1.0483 |
| Daily Fibonacci 38.2% | 1.0849 |
| Daily Fibonacci 61.8% | 1.0884 |
| Daily Pivot Point S1 | 1.0744 |
| Daily Pivot Point S2 | 1.0695 |
| Daily Pivot Point S3 | 1.0597 |
| Daily Pivot Point R1 | 1.0891 |
| Daily Pivot Point R2 | 1.0989 |
| Daily Pivot Point R3 | 1.1038 |
[/s2If]
Join Our Telegram Group
")


