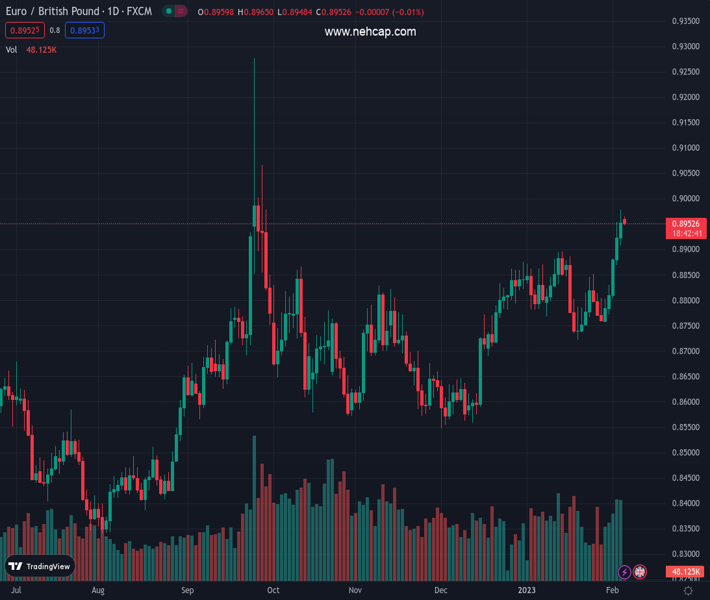
#EURGBP @ 0.89528 is displaying back-and-forth moves ahead of the Eurozone Retail Sales data. (Pivot Orderbook analysis)
…
This is a premium post.
[s2If !current_user_can(access_s2member_level4)]Please register for PREMIUM VERSION HERE to read full post below containing analysis. In case of any error or you think you are not able to read the full post below, please email us at support#nehcap.com [lwa][/s2If] [s2If current_user_can(access_s2member_level4)]
- EUR/GBP is displaying back-and-forth moves ahead of the Eurozone Retail Sales data.
- Upward sloping 50-and 200-period EMAs add to the upside filters.
- A bullish range shift by the RSI (14) indicates that the upside momentum is active.
The pair currently trades last at 0.89528.
The previous day high was 0.8979 while the previous day low was 0.8913. The daily 38.2% Fib levels comes at 0.8953, expected to provide resistance. Similarly, the daily 61.8% fib level is at 0.8938, expected to provide support.
The EUR/GBP pair has turned sideways after a minor corrective move from 0.8980 in the Asian session. The cross is displaying a subdued performance after a five-day winning streak as long liquidation by the market participants has been triggered.
On Monday, the cross will dance to the tunes of Eurozone Retail Sales data. The economic data is expected to contract by 2.7% from a prior contraction of 2.8% on an annual basis. The monthly data is seen contracting by 2.5% against an expansion of 0.8% reported earlier. Households demand has been declining for a few months and a further decline will trim inflation projections, and eventually will delight the European Central Bank (ECB).
EUR/GBP is demonstrating a loss in the upside momentum after delivering a breakout of the symmetrical triangle chart pattern on the daily scale that indicates a sheer decline in volatility, which results in wider ticks and heavy volume after a breakout. Horizontal support is plotted from January 12 high at 0.8867.
Upward sloping 50-and 200-period Exponential Moving Averages (EMAs) at 0.8794 and 0.8662 respectively, add to the upside filters.
The Relative Strength Index (RSI) (14) has shifted into the bullish range of 60.00-80.00, which indicates that the upside momentum is active.
After a sheer upside move, a mean-reversion to near the 10-period Exponential Moving Average (EMA) at 0.8868, at the press time, will be a bargain buy for the market participants for an upside to February 2 high at 0.8950 followed by the psychological resistance at 0.9000.
Alternatively, a breakdown of January 27 low at 0.8765 will drag the asset toward January 19 low at 0.8722. A slippage below the latter will drag the cross toward October 4 low at 0.8649.
Technical Levels: Supports and Resistances
EURGBP currently trading at 0.8952 at the time of writing. Pair opened at 0.8957 and is trading with a change of -0.06 % .
| Overview | Overview.1 | |
|---|---|---|
| 0 | Today last price | 0.8952 |
| 1 | Today Daily Change | -0.0005 |
| 2 | Today Daily Change % | -0.0600 |
| 3 | Today daily open | 0.8957 |
The pair remains strongly bullish on the daily timeframe. It trades above its 20 SMA @ 0.8823, 50 SMA 0.8759, 100 SMA @ 0.8744 and 200 SMA @ 0.8633.
| Trends | Trends.1 | |
|---|---|---|
| 0 | Daily SMA20 | 0.8823 |
| 1 | Daily SMA50 | 0.8759 |
| 2 | Daily SMA100 | 0.8744 |
| 3 | Daily SMA200 | 0.8633 |
The previous day high was 0.8979 while the previous day low was 0.8913. The daily 38.2% Fib levels comes at 0.8953, expected to provide resistance. Similarly, the daily 61.8% fib level is at 0.8938, expected to provide support.
Note the levels of interest below:
- Pivot support is noted at 0.892, 0.8883, 0.8854
- Pivot resistance is noted at 0.8986, 0.9015, 0.9052
| Levels | Levels.1 |
|---|---|
| Previous Daily High | 0.8979 |
| Previous Daily Low | 0.8913 |
| Previous Weekly High | 0.8979 |
| Previous Weekly Low | 0.8763 |
| Previous Monthly High | 0.8897 |
| Previous Monthly Low | 0.8722 |
| Daily Fibonacci 38.2% | 0.8953 |
| Daily Fibonacci 61.8% | 0.8938 |
| Daily Pivot Point S1 | 0.8920 |
| Daily Pivot Point S2 | 0.8883 |
| Daily Pivot Point S3 | 0.8854 |
| Daily Pivot Point R1 | 0.8986 |
| Daily Pivot Point R2 | 0.9015 |
| Daily Pivot Point R3 | 0.9052 |
[/s2If]
Join Our Telegram Group
")


