#XAUUSD @ 1,864.91 Gold price justifies downside break of key support line as sellers attack one-month low., @nehcap view: Further downside expected (Pivot Orderbook analysis)
…
This is a premium post.
[s2If !current_user_can(access_s2member_level4)]Please register for PREMIUM VERSION HERE to read full post below containing analysis. In case of any error or you think you are not able to read the full post below, please email us at support#nehcap.com [lwa][/s2If] [s2If current_user_can(access_s2member_level4)]
- Gold price justifies downside break of key support line as sellers attack one-month low.
- Strong United States data underpinned recovery in US Treasury bond yields, US Dollar and weighed on XAU/USD.
- US-China tussles add strength to geopolitical tension and favor Gold sellers.
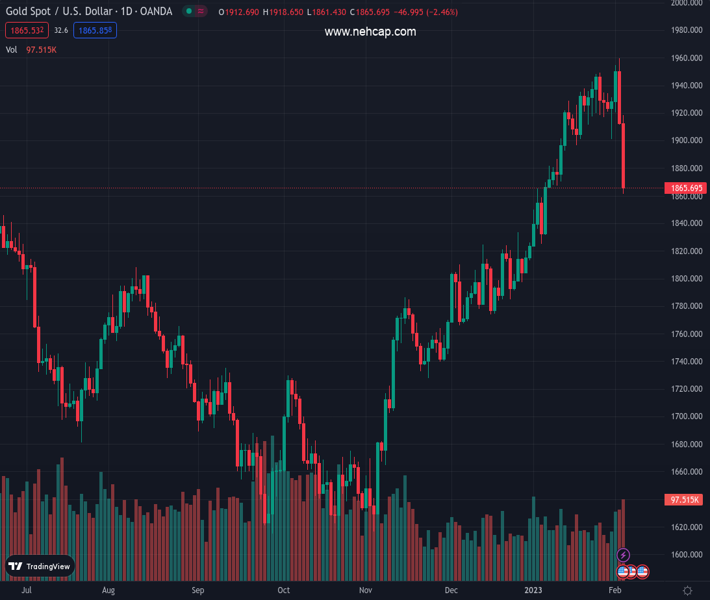
The pair currently trades last at 1864.91.
The previous day high was 1918.65 while the previous day low was 1861.45. The daily 38.2% Fib levels comes at 1883.3, expected to provide resistance. Similarly, the daily 61.8% fib level is at 1896.8, expected to provide resistance.
Gold price (XAU/USD) holds lower ground near $1,865, after declining to the fresh one-month low the previous day. The metal’s latest weakness could be linked to the strong United States data renewing inflation fears, as well as downbeat rate hike performances of the European Central Bank and the Bank of England (BoE). Also exerting downside pressure on the XAU/USD is the fresh geopolitical tension surrounding the US-China ties. Above all, the recovery in the US Treasury bond yield renewed the US Dollar and recalled the Gold bears after a month-long absence.
Although the United States Federal Reserve (Fed) announced a dovish rate hike, the strong US economics surrounding jobs and activities renewed inflation fears and favored the odds of further rate increases from the Fed.
On Friday, the US Bureau of Labor Statistics (BLS) surprised markets by revealing that the Nonfarm Payrolls (NFP) rose by 517K in January, versus 185K expected and 260K (upwardly revised) prior. It’s worth noting that the Unemployment Rate also dropped to 3.4% from 3.5% prior and 3.6% expected but the Average Hourly Earnings eased during the stated month.
Other than the headline US job numbers, the rebound in the US ISM Services PMI from 49.2 to 55.2, versus 50.4 expected, also underpinned the rebound in the United States Treasury bond yields and the US Dollar.
That said, the benchmark US 10-year Treasury bond yields jumped the most since late September 2022 to regain 3.52% level by the volatile week’s end. The same propelled the US Dollar to recover from the lowest levels since April 2022 and weigh on the Gold price.
Last week, the European Central Bank (ECB) announced a 0.50% interest rate hike by matching the market expectations.
Following the interest rate announcements, ECB President Christine Lagarde said, “We haven’t reached the peak in rate, we have ground to cover.” The policymaker also signaled that the risks to inflation and growth are more balanced.
On the other hand, the Bank of England (BoE) announced a 0.50% interest rate hike by matching the market expectations. Following the interest rate announcements, BoE Governor Andrew Bailey said, “BoE’s forecast suggests inflation will come down, fall quite sharply.”
Asked if rates might have peaked, says “we have changed the language we used.” BoE’s Bailey also added, “Change in language reflects a turning in the corner but very early days.”
On a different pate, BoE Chief Economist Huw Pill told Times Radio on Friday that it’s important for the BoE to not do “too much” on monetary policy, per Reuters.
Other than the United States data and monetary policy moves at the European Central Bank (ECB), as well as at the Bank of England (BoE), the latest geopolitical tension surrounding the US and China also exerts downside pressure on the Gold price.
“A US military fighter jet shot down a suspected Chinese spy balloon off the coast of South Carolina on Saturday, a week after it first entered US airspace and triggered a dramatic — and public — spying saga that worsened Sino-US relations,” said Reuters.
Looking forward, Gold traders should pay attention to Federal Reserve Chairman Jerome Powell’s speech and preliminary readings of the UoM Consumer Sentiment Index for February, as well as the University of Michigan’s 5-year Consumer Inflation expectations, for fresh impulse. If Fed’s Powell manages to regain his hawkish bias, based on the recently firmer US data, the XAU/USD has a further downside to track.
Gold price broke key support lines stretched from November during the last week and pushed back the bullish bias, at least for now.
The downside expectations also take clues from the below 50 Relative Strength Index (RSI) line, placed at 40, as well as bearish signals from the Moving Average Convergence and Divergence (MACD) indicator.
That said, the XAU/USD declines to the 50-Day Moving Average (DMA), currently around $1,845, appear imminent. However, multiple tops marked during the last December near $1,825-23 could act as the last defense of the Gold buyers.
Alternatively, an upward-sloping trend line from November 23, previous support surrounding $1,878, guards immediate recovery of the Gold price. Following that, a three-month-old support-turned-resistance line could challenge the XAU/USD bulls near $1,925.
Overall, Gold price is likely to witness further downside but the trend reversal is far from sight.
Trend: Further downside expected
Technical Levels: Supports and Resistances
XAUUSD currently trading at 1864.86 at the time of writing. Pair opened at 1864.86 and is trading with a change of 0.00% % .
| Overview | Overview.1 | |
|---|---|---|
| 0 | Today last price | 1864.86 |
| 1 | Today Daily Change | 0.00 |
| 2 | Today Daily Change % | 0.00% |
| 3 | Today daily open | 1864.86 |
The pair is trading below its 20 Daily moving average @ 1914.36, above its 50 Daily moving average @ 1846.04 , above its 100 Daily moving average @ 1766.47 and above its 200 Daily moving average @ 1775.99
| Trends | Trends.1 | |
|---|---|---|
| 0 | Daily SMA20 | 1914.36 |
| 1 | Daily SMA50 | 1846.04 |
| 2 | Daily SMA100 | 1766.47 |
| 3 | Daily SMA200 | 1775.99 |
The previous day high was 1918.65 while the previous day low was 1861.45. The daily 38.2% Fib levels comes at 1883.3, expected to provide resistance. Similarly, the daily 61.8% fib level is at 1896.8, expected to provide resistance.
Note the levels of interest below:
- Pivot support is noted at 1844.66, 1824.45, 1787.46
- Pivot resistance is noted at 1901.86, 1938.85, 1959.06
| Levels | Levels.1 |
|---|---|
| Previous Daily High | 1918.65 |
| Previous Daily Low | 1861.45 |
| Previous Weekly High | 1959.80 |
| Previous Weekly Low | 1861.45 |
| Previous Monthly High | 1949.27 |
| Previous Monthly Low | 1823.76 |
| Daily Fibonacci 38.2% | 1883.30 |
| Daily Fibonacci 61.8% | 1896.80 |
| Daily Pivot Point S1 | 1844.66 |
| Daily Pivot Point S2 | 1824.45 |
| Daily Pivot Point S3 | 1787.46 |
| Daily Pivot Point R1 | 1901.86 |
| Daily Pivot Point R2 | 1938.85 |
| Daily Pivot Point R3 | 1959.06 |
[/s2If]
Join Our Telegram Group
")


