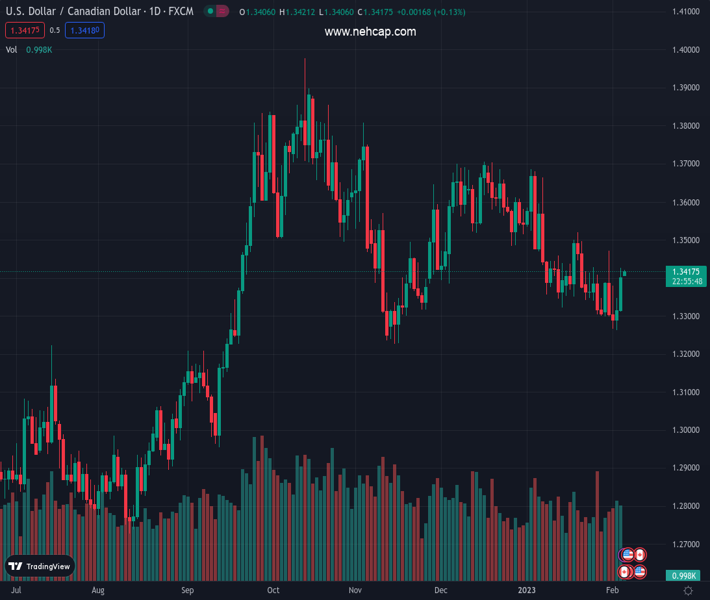
#USDCAD @ 1.33960 begins the key week on a firmer footing, mildly bid during three-day uptrend. (Pivot Orderbook analysis)
…
This is a premium post.
[s2If !current_user_can(access_s2member_level4)]Please register for PREMIUM VERSION HERE to read full post below containing analysis. In case of any error or you think you are not able to read the full post below, please email us at support#nehcap.com [lwa][/s2If] [s2If current_user_can(access_s2member_level4)]
- USD/CAD begins the key week on a firmer footing, mildly bid during three-day uptrend.
- Upbeat US data, geopolitical tension propelled US Dollar, weighed on Oil price of late.
- BoC Governor Macklem’s speech, Canada jobs report for January will be crucial for immediate directions.
The pair currently trades last at 1.33960.
The previous day high was 1.3427 while the previous day low was 1.3308. The daily 38.2% Fib levels comes at 1.3381, expected to provide support. Similarly, the daily 61.8% fib level is at 1.3353, expected to provide support.
USD/CAD prints mild gains around 1.3415 as bulls keep the reins at the start of the key week for Loonie traders. In doing so, the quote prints three-day uptrend while justifying firmer US Dollar and the downbeat prices of Oil, Canada’s main export item.
Be it the unimpressive interest rate hikes by the European Central Bank (ECB) and the Bank of England (BoE) or the strong US data, the US Dollar had it all to recover from the multi-month low. That said, the US Dollar Index (DXY) managed to post the biggest weekly gains since September 2022, not to forget snapping three-week downtrend, in the last.
On Thursday, the ECB and the BoE both matched market forecasts by announcing 0.50% hike in their respective benchmark rates. The policymakers also tried to sound hawkish but couldn’t hide the receding inflation fears, which in turn suggested lesser need for strong rate increases. The same joined downbeat tech earnings reports and helped the DXY to rebound from the lowest levels since April 2022.
Following that, the US Bureau of Labor Statistics (BLS) surprised markets by revealing that the Nonfarm Payrolls (NFP) rose by 517K in January, versus 185K expected and 260K (upwardly revised) prior. It’s worth noting that the Unemployment Rate also dropped to 3.4% from 3.5% prior and 3.6% expected but the Average Hourly Earnings eased during the stated month.
Other than the headline US job numbers, the rebound in the US ISM Services PMI from 49.2 to 55.2, versus 50.4 expected, also underpinned the rebound in the United States Treasury bond yields and the US Dollar. That said, the benchmark US 10-year Treasury bond yields jumped the most since late September 2022 to regain 3.52% level by the volatile week’s end.
Additionally helping the US Dollar are the recent fears emanating from surrounding the US and China. “A US military fighter jet shot down a suspected Chinese spy balloon off the coast of South Carolina on Saturday, a week after it first entered US airspace and triggered a dramatic — and public — spying saga that worsened Sino-US relations,” said Reuters.
Elsewhere, WTI crude oil dropped in the last three consecutive days to $73.45 as firmer US Dollar and fresh fears surrounding the gap for the Fed doves before they retake control, due to the strong data, weigh on the commodity prices.
Moving on, Tuesday becomes the key day for the USD/CAD pair as Bank of Canada (BoC) Governor Tiff Macklem and Federal Reserve (Fed) Chairman Jerome Powell both will appear for speeches. Following that, Friday’s Canada jobs report for January and the US UoM Consumer Sentiment Index for February, as well as the University of Michigan’s 5-year Consumer Inflation expectations, will be crucial for fresh impulse.
Although an upward-sloping support line from June 2022, around 1.3310 by the press time, defends USD/CAD buyers, the Loonie pair’s upside remains elusive until the quote stays below the 50-DMA level of near 1.3500.
Technical Levels: Supports and Resistances
USDCAD currently trading at 1.3421 at the time of writing. Pair opened at 1.3401 and is trading with a change of 0.15% % .
| Overview | Overview.1 | |
|---|---|---|
| 0 | Today last price | 1.3421 |
| 1 | Today Daily Change | 0.0020 |
| 2 | Today Daily Change % | 0.15% |
| 3 | Today daily open | 1.3401 |
The pair is trading above its 20 Daily moving average @ 1.338, below its 50 Daily moving average @ 1.3499 , below its 100 Daily moving average @ 1.3534 and above its 200 Daily moving average @ 1.3222
| Trends | Trends.1 | |
|---|---|---|
| 0 | Daily SMA20 | 1.3380 |
| 1 | Daily SMA50 | 1.3499 |
| 2 | Daily SMA100 | 1.3534 |
| 3 | Daily SMA200 | 1.3222 |
The previous day high was 1.3427 while the previous day low was 1.3308. The daily 38.2% Fib levels comes at 1.3381, expected to provide support. Similarly, the daily 61.8% fib level is at 1.3353, expected to provide support.
Note the levels of interest below:
- Pivot support is noted at 1.333, 1.326, 1.3211
- Pivot resistance is noted at 1.3449, 1.3498, 1.3568
| Levels | Levels.1 |
|---|---|
| Previous Daily High | 1.3427 |
| Previous Daily Low | 1.3308 |
| Previous Weekly High | 1.3472 |
| Previous Weekly Low | 1.3262 |
| Previous Monthly High | 1.3685 |
| Previous Monthly Low | 1.3300 |
| Daily Fibonacci 38.2% | 1.3381 |
| Daily Fibonacci 61.8% | 1.3353 |
| Daily Pivot Point S1 | 1.3330 |
| Daily Pivot Point S2 | 1.3260 |
| Daily Pivot Point S3 | 1.3211 |
| Daily Pivot Point R1 | 1.3449 |
| Daily Pivot Point R2 | 1.3498 |
| Daily Pivot Point R3 | 1.3568 |
[/s2If]
Join Our Telegram Group
")


