#NZDUSD @ 0.63320 seesaws around intraday low, mildly offered during three-day downtrend. (Pivot Orderbook analysis)
…
This is a premium post.
[s2If !current_user_can(access_s2member_level4)]Please register for PREMIUM VERSION HERE to read full post below containing analysis. In case of any error or you think you are not able to read the full post below, please email us at support#nehcap.com [lwa][/s2If] [s2If current_user_can(access_s2member_level4)]
- NZD/USD seesaws around intraday low, mildly offered during three-day downtrend.
- Markets in New Zealand are off due to Waitangi Day celebration.
- Strong US data, fresh geopolitical fears surrounding China weigh on Kiwi prices.
- Light calendar in NZ emphasizes Fed Chair Powell’s reaction to recent hawkish market signals for fresh impulse.
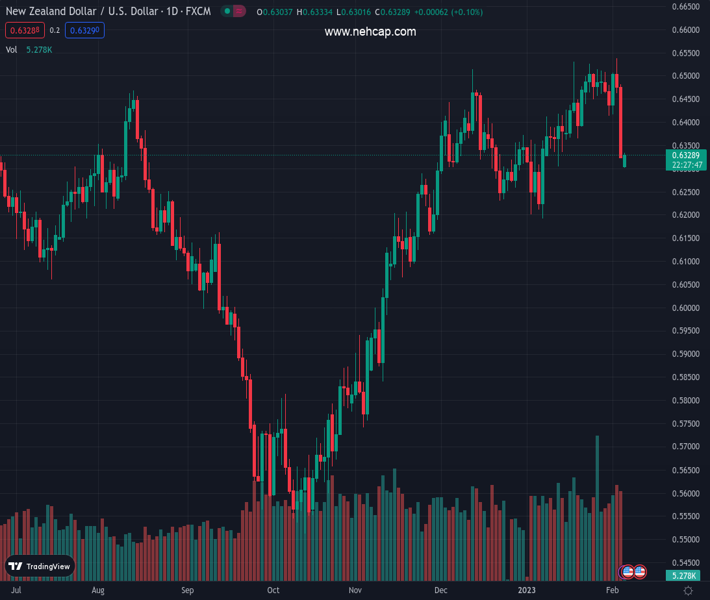
The pair currently trades last at 0.63320.
The previous day high was 0.6485 while the previous day low was 0.6322. The daily 38.2% Fib levels comes at 0.6384, expected to provide resistance. Similarly, the daily 61.8% fib level is at 0.6423, expected to provide resistance.
NZD/USD remains depressed as it flirts with short-term key support around 0.6300 during early Monday in Asia, following a downside gap to begin the week’s trading. In doing so, the Kiwi pair justifies the market’s risk-off mood and firmer US data amid a holiday in New Zealand (NZ) markets.
Market sentiment worsens amid strong US data renewing hawkish bias for the Federal Reserve (Fed), as well as due to the geopolitical tension surrounding China.
That said, the US Bureau of Labor Statistics (BLS) surprised markets by revealing that the Nonfarm Payrolls (NFP) rose by 517K in January, versus 185K expected and 260K (upwardly revised) prior. It’s worth noting that the Unemployment Rate also dropped to 3.4% from 3.5% prior and 3.6% expected but the Average Hourly Earnings eased during the stated month.
Other than the headline US job numbers, the rebound in the US ISM Services PMI from 49.2 to 55.2, versus 50.4 expected, also underpinned the rebound in the United States Treasury bond yields and the US Dollar. That said, the benchmark US 10-year Treasury bond yields jumped the most since late September 2022 to regain 3.52% level by the volatile week’s end.
On the other hand, the recent fears surrounding the US and China ahead of this week’s US diplomat visit to China also weigh on the market’s risk appetite. “A US military fighter jet shot down a suspected Chinese spy balloon off the coast of South Carolina on Saturday, a week after it first entered US airspace and triggered a dramatic — and public — spying saga that worsened Sino-US relations,” said Reuters.
While portraying the mood, S&P 500 Futures drops 0.40% while the US 10-year Treasury bond yields remain sluggish near 3.52% by the press time.
At home, the last week’s New Zealand jobs report eased pressure on the Reserve Bank of New Zealand (RBNZ) to act fast, which in turn joins a light calendar at home during this week to allow the NZD/USD buyers to take a breather.
However, Tuesday’s speech from Federal Reserve (Fed) Chairman Jerome Powel and Friday’s US UoM Consumer Sentiment Index for February, as well as the University of Michigan’s 5-year Consumer Inflation expectations, will be crucial for fresh impulse.
An upward-sloping trend line from mid-November 2022, around 0.6300 by the press time, appears the immediate challenge for the NZD/UDS bears to tackle.
Technical Levels: Supports and Resistances
NZDUSD currently trading at 0.6317 at the time of writing. Pair opened at 0.6324 and is trading with a change of -0.11% % .
| Overview | Overview.1 | |
|---|---|---|
| 0 | Today last price | 0.6317 |
| 1 | Today Daily Change | -0.0007 |
| 2 | Today Daily Change % | -0.11% |
| 3 | Today daily open | 0.6324 |
The pair is trading below its 20 Daily moving average @ 0.6434, below its 50 Daily moving average @ 0.637 , above its 100 Daily moving average @ 0.6107 and above its 200 Daily moving average @ 0.6191
| Trends | Trends.1 | |
|---|---|---|
| 0 | Daily SMA20 | 0.6434 |
| 1 | Daily SMA50 | 0.6370 |
| 2 | Daily SMA100 | 0.6107 |
| 3 | Daily SMA200 | 0.6191 |
The previous day high was 0.6485 while the previous day low was 0.6322. The daily 38.2% Fib levels comes at 0.6384, expected to provide resistance. Similarly, the daily 61.8% fib level is at 0.6423, expected to provide resistance.
Note the levels of interest below:
- Pivot support is noted at 0.6269, 0.6214, 0.6106
- Pivot resistance is noted at 0.6432, 0.654, 0.6595
| Levels | Levels.1 |
|---|---|
| Previous Daily High | 0.6485 |
| Previous Daily Low | 0.6322 |
| Previous Weekly High | 0.6538 |
| Previous Weekly Low | 0.6322 |
| Previous Monthly High | 0.6531 |
| Previous Monthly Low | 0.6190 |
| Daily Fibonacci 38.2% | 0.6384 |
| Daily Fibonacci 61.8% | 0.6423 |
| Daily Pivot Point S1 | 0.6269 |
| Daily Pivot Point S2 | 0.6214 |
| Daily Pivot Point S3 | 0.6106 |
| Daily Pivot Point R1 | 0.6432 |
| Daily Pivot Point R2 | 0.6540 |
| Daily Pivot Point R3 | 0.6595 |
[/s2If]
Join Our Telegram Group
")


