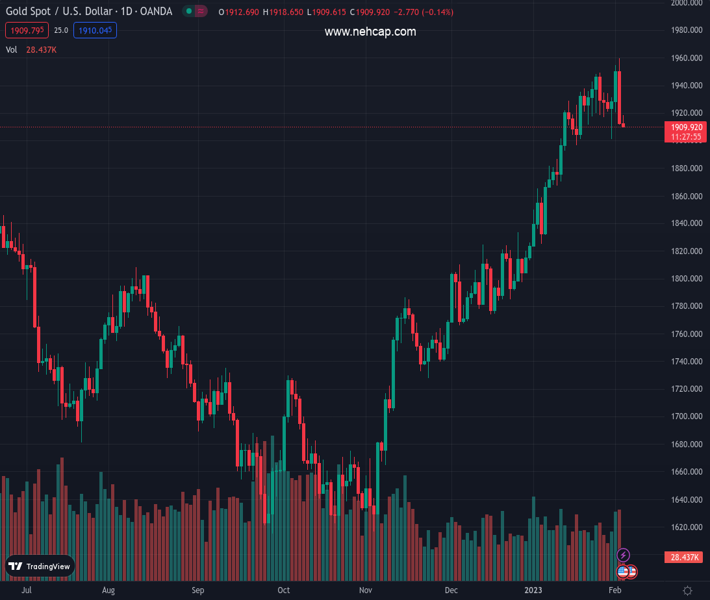
#XAUUSD @ 1,910.00 Gold price struggles to gain any meaningful traction and oscillates in a range on Friday. (Pivot Orderbook analysis)
…
This is a premium post.
[s2If !current_user_can(access_s2member_level4)]Please register for PREMIUM VERSION HERE to read full post below containing analysis. In case of any error or you think you are not able to read the full post below, please email us at support#nehcap.com [lwa][/s2If] [s2If current_user_can(access_s2member_level4)]
- Gold price struggles to gain any meaningful traction and oscillates in a range on Friday.
- Traders now seem to have moved to the sidelines ahead of the key US monthly jobs data.
- Bets for more rate hikes by Federal Reserve underpin US Dollar and act as a headwind.
The pair currently trades last at 1910.00.
The previous day high was 1959.8 while the previous day low was 1911.39. The daily 38.2% Fib levels comes at 1929.88, expected to provide resistance. Similarly, the daily 61.8% fib level is at 1941.31, expected to provide resistance.
Gold price finds some support near the $1,910 region and for now, seems to have stalled the previous day’s sharp retracement slide from the highest since April 2022. The XAU/USD, however, seems to struggle to gain any traction and oscillates in a range around the $1,915 area through the first half of the European session.
The US Dollar (USD) manages to preserve the overnight recovery gains from a nine-month low, which, in turn, is seen as a key factor acting as a headwind for the US Dollar-denominated Gold price. The USD draws support from hopes for a positive surprise from the Nonfarm Payrolls (NFP), due later during the early North American session from the United States. The expectations were fueled by the upbeat Weekly Initial Jobless Claims released on Thursday, which pointed to the underlying strength in the labor market.
The upbeat data, meanwhile, forces investors to scale back their bets for an imminent pause in the Federal Reserve’s (Fed) rate hike cycle. This is seen as another factor lending support to the buck and capping the upside for the non-yielding Gold price. That said, a modest downtick in the US Treasury bond yields holds back the USD bulls from placing aggressive bets. Apart from this, a generally weaker tone around the equity markets contributes to limiting the downside for the safe-haven XAU/USD, for the time being.
Traders also seem reluctant and prefer to wait on the sidelines ahead of the release of the closely-watched US monthly employment details. The report is expected to show that the economy added 185K jobs in January, down from 223K in the previous month. Moreover, the jobless rate is anticipated to edge higher to 3.6% from 3.5% in December. The key US macro data will influence the USD demand and provide a fresh impetus to Gold price. Nevertheless, the XAU/USD remains on track for its first weekly fall in seven.
From a technical perspective, any subsequent slide is likely to find decent support near the $1,900 round-figure mark. A convincing break below might prompt technical selling and expose the $1,880-$1,877 support zone. Gold price could eventually slide to test the next relevant support near the $1,856-$1,855 region.
On the flip side, the $1,920 level now seems to act as an immediate hurdle, above which the XAU/USD could climb back to the $1,949-$1,950 region. Some follow-through buying should allow Gold price to surpass an intermediate hurdle near the $1.970-$1,980 area and aim to reclaim the $2,000 psychological mark for the first time since March 2022.
Key levels to watch
Technical Levels: Supports and Resistances
XAUUSD currently trading at 1911.23 at the time of writing. Pair opened at 1912.86 and is trading with a change of -0.09 % .
| Overview | Overview.1 | |
|---|---|---|
| 0 | Today last price | 1911.23 |
| 1 | Today Daily Change | -1.63 |
| 2 | Today Daily Change % | -0.09 |
| 3 | Today daily open | 1912.86 |
The pair is trading below its 20 Daily moving average @ 1914.47, above its 50 Daily moving average @ 1843.87 , above its 100 Daily moving average @ 1764.57 and above its 200 Daily moving average @ 1776.15
| Trends | Trends.1 | |
|---|---|---|
| 0 | Daily SMA20 | 1914.47 |
| 1 | Daily SMA50 | 1843.87 |
| 2 | Daily SMA100 | 1764.57 |
| 3 | Daily SMA200 | 1776.15 |
The previous day high was 1959.8 while the previous day low was 1911.39. The daily 38.2% Fib levels comes at 1929.88, expected to provide resistance. Similarly, the daily 61.8% fib level is at 1941.31, expected to provide resistance.
Note the levels of interest below:
- Pivot support is noted at 1896.23, 1879.61, 1847.82
- Pivot resistance is noted at 1944.64, 1976.43, 1993.05
| Levels | Levels.1 |
|---|---|
| Previous Daily High | 1959.80 |
| Previous Daily Low | 1911.39 |
| Previous Weekly High | 1949.27 |
| Previous Weekly Low | 1911.45 |
| Previous Monthly High | 1949.27 |
| Previous Monthly Low | 1823.76 |
| Daily Fibonacci 38.2% | 1929.88 |
| Daily Fibonacci 61.8% | 1941.31 |
| Daily Pivot Point S1 | 1896.23 |
| Daily Pivot Point S2 | 1879.61 |
| Daily Pivot Point S3 | 1847.82 |
| Daily Pivot Point R1 | 1944.64 |
| Daily Pivot Point R2 | 1976.43 |
| Daily Pivot Point R3 | 1993.05 |
[/s2If]
Join Our Telegram Group
")


