WTI is set to finish the week with more than 2% losses. (Pivot Orderbook analysis)
…
This is a premium post.
[s2If !current_user_can(access_s2member_level4)]Please register for PREMIUM VERSION HERE to read full post below containing analysis. In case of any error or you think you are not able to read the full post below, please email us at support#nehcap.com [lwa][/s2If] [s2If current_user_can(access_s2member_level4)]
- WTI is set to finish the week with more than 2% losses.
- Factors like solid US jobs data and the EU’s embargo on Russian oil-related products underpin WTI.
- WTI Technical Analysis: Near-term shifted upward biased, and it might test $80.00.
The pair currently trades last at 77.34.
The previous day high was 77.4 while the previous day low was 75.16. The daily 38.2% Fib levels comes at 76.02, expected to provide support. Similarly, the daily 61.8% fib level is at 76.55, expected to provide support.
The US crude oil benchmark, known as Western Texas Intermediate (WTI)., jumped after the release of a solid job report in the United States (US), though prices are still headed for a weekly loss. At the time of writing, WTI exchanges hand at $77.85 per barrel, at the time of writing.
WTI’s extended its gains on Friday due to a surprising report from the US Department of Labor (DoL) which showed that in January, the economy created 517,000 jobs, surpassing the expected 200,000. As a result, the Unemployment Rate decreased from 3.5% to 3.4%, and the previous month’s figures were revised upwards.
In the meantime, the European oil embargo on Russian refined products that would begin on February 5 is being eyed by oil traders. Russian authorities commented that the EU’s ban could lead to a further imbalance in the global energy markets.
Meanwhile, according to ANZ analysts, China’s reopening has witnessed a sharp increase in traffic in its largest 15 cities following the lunar new year holiday.
All that said, WTI might continue to trim some of its weekly losses as investors are eyeing the 20-day Exponential Moving Average (EMA) at $78.47. Once broken, that could open the door for further upside.
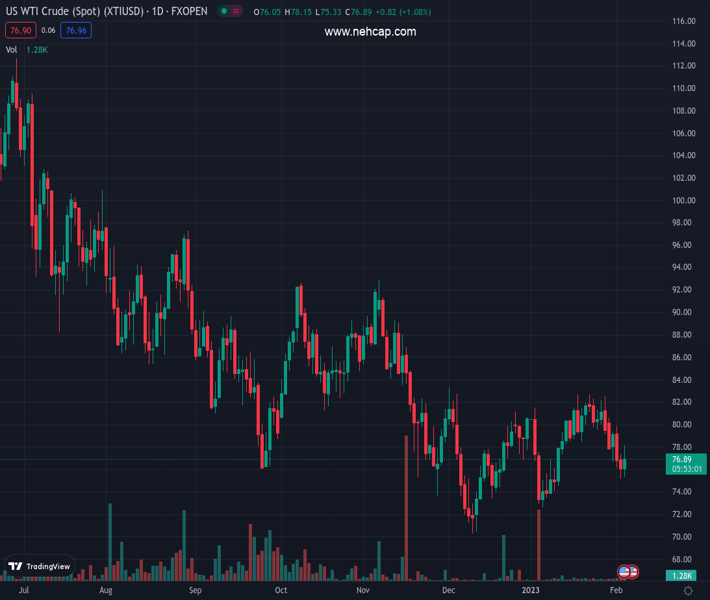
WTI’s daily chart portrays oil forming a bullish engulfing candle pattern after bouncing from three-week lows. Although the two-candle pattern is bullish, WTI still needs to hurdle essential resistance levels on the upside. WTI’s first resistance would be the 20-day EMA at $78.42, followed by the 50-day EMA at $79.19, which, once cleated, could pave the way toward the $80.00 per barrel figure.
Technical Levels: Supports and Resistances
XTIUSD currently trading at 77.34 at the time of writing. Pair opened at 76.0 and is trading with a change of 1.76 % .
| Overview | Overview.1 | |
|---|---|---|
| 0 | Today last price | 77.34 |
| 1 | Today Daily Change | 1.34 |
| 2 | Today Daily Change % | 1.76 |
| 3 | Today daily open | 76.00 |
The pair remains strongly bearish on the daily time frame. It trades below the 20 SMA @ 78.83, 50 SMA 77.71, 100 SMA @ 81.23 and 200 SMA @ 90.92.
| Trends | Trends.1 | |
|---|---|---|
| 0 | Daily SMA20 | 78.83 |
| 1 | Daily SMA50 | 77.71 |
| 2 | Daily SMA100 | 81.23 |
| 3 | Daily SMA200 | 90.92 |
The previous day high was 77.4 while the previous day low was 75.16. The daily 38.2% Fib levels comes at 76.02, expected to provide support. Similarly, the daily 61.8% fib level is at 76.55, expected to provide support.
Note the levels of interest below:
- Pivot support is noted at 74.97, 73.94, 72.72
- Pivot resistance is noted at 77.22, 78.43, 79.46
| Levels | Levels.1 |
|---|---|
| Previous Daily High | 77.40 |
| Previous Daily Low | 75.16 |
| Previous Weekly High | 82.68 |
| Previous Weekly Low | 79.15 |
| Previous Monthly High | 82.68 |
| Previous Monthly Low | 72.64 |
| Daily Fibonacci 38.2% | 76.02 |
| Daily Fibonacci 61.8% | 76.55 |
| Daily Pivot Point S1 | 74.97 |
| Daily Pivot Point S2 | 73.94 |
| Daily Pivot Point S3 | 72.72 |
| Daily Pivot Point R1 | 77.22 |
| Daily Pivot Point R2 | 78.43 |
| Daily Pivot Point R3 | 79.46 |
[/s2If]
Join Our Telegram Group
")


