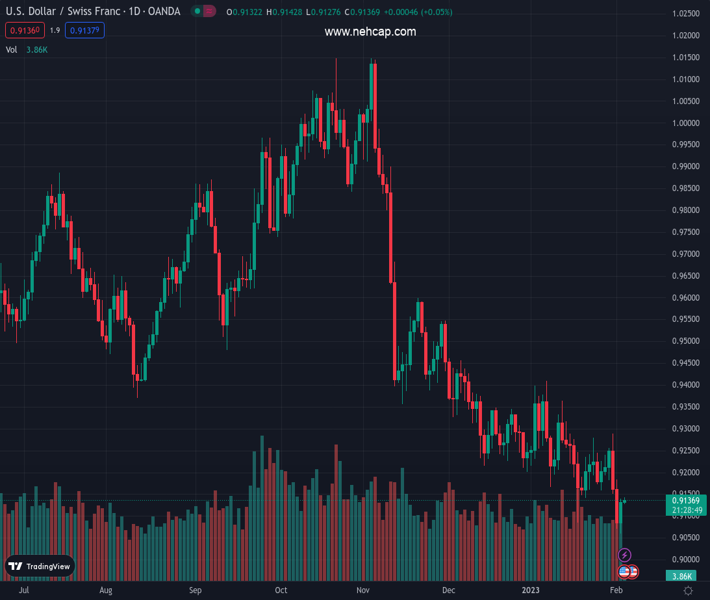
#USDCHF @ 0.91378 is facing barricades in stretching its recovery move above the 0.9140-0.9160 supply zone. (Pivot Orderbook analysis)
…
This is a premium post.
[s2If !current_user_can(access_s2member_level4)]Please register for PREMIUM VERSION HERE to read full post below containing analysis. In case of any error or you think you are not able to read the full post below, please email us at support#nehcap.com [lwa][/s2If] [s2If current_user_can(access_s2member_level4)]
- USD/CHF is facing barricades in stretching its recovery move above the 0.9140-0.9160 supply zone.
- A hawkish commentary from SNB Chairman failed to strengthen the Swiss Franc bulls.
- The RSI (14) is struggling to scale into the bullish range of 60.00-80.00.
The pair currently trades last at 0.91378.
The previous day high was 0.914 while the previous day low was 0.9059. The daily 38.2% Fib levels comes at 0.9109, expected to provide support. Similarly, the daily 61.8% fib level is at 0.909, expected to provide support.
The USD/CHF pair has rebounded after a corrective move to near 0.9115 in the early Asian session. The Swiss franc asset is struggling to stretch an upside rally further as the US Dollar Index (DXY) has turned sideways ahead of the United States Nonfarm Payrolls (NFP) data.
Meanwhile, a hawkish commentary from Swiss National Bank (SNB) Chairman Thomas J. Jordan failed to strengthen the Swiss Franc bulls. SNB’s Jordan confirmed more interest rate hikes as inflationary pressures are stronger than the central bank can tolerate. The SNB is ready to be active in currency markets when necessary.
S&P500 futures have dropped sharply in the Asian session after a three-day winning spell, portraying a sheer decline in investors’ risk appetite. The 10-year US Treasury yields have dropped below 3.40%.
USD/CHF displayed a stellar recovery after testing previous lows plotted from January 18 low at 0.9085 on an hourly scale. The recovery action was extremely solid as it pushed the asset above the 20-and 50-period Exponential Moving Averages (EMAs) at 0.9120 and 0.9130 respectively in no time.
The Swiss franc asset has reached near the supply zone in a 0.9140-0.9160 range. It would be optimal to observe the price action around the supply range before making any constructive position.
Also, the Relative Strength Index (RSI) (14) is struggling to scale into the bullish range of 60.00-80.00. An occurrence of the same will trigger the upside momentum.
For further upside, the major needs to deliver a confident move above the 0.9140-0.9160 supply zone, which will drive the asset toward January 18 high at 0.9246 followed by January 24 high at 0.9280.
On the flip side, a breakdown of Wednesday’s low at 0.9059 will drag the major toward 4 August 2021 low at 0.9018. A slippage below the latter will drag the asset further toward 10 May 2021 low at 0.8986.
Technical Levels: Supports and Resistances
USDCHF currently trading at 0.9141 at the time of writing. Pair opened at 0.9135 and is trading with a change of 0.07 % .
| Overview | Overview.1 | |
|---|---|---|
| 0 | Today last price | 0.9141 |
| 1 | Today Daily Change | 0.0006 |
| 2 | Today Daily Change % | 0.0700 |
| 3 | Today daily open | 0.9135 |
The pair remains strongly bearish on the daily time frame. It trades below the 20 SMA @ 0.9213, 50 SMA 0.9292, 100 SMA @ 0.9552 and 200 SMA @ 0.9622.
| Trends | Trends.1 | |
|---|---|---|
| 0 | Daily SMA20 | 0.9213 |
| 1 | Daily SMA50 | 0.9292 |
| 2 | Daily SMA100 | 0.9552 |
| 3 | Daily SMA200 | 0.9622 |
The previous day high was 0.914 while the previous day low was 0.9059. The daily 38.2% Fib levels comes at 0.9109, expected to provide support. Similarly, the daily 61.8% fib level is at 0.909, expected to provide support.
Note the levels of interest below:
- Pivot support is noted at 0.9083, 0.9031, 0.9003
- Pivot resistance is noted at 0.9163, 0.9191, 0.9243
| Levels | Levels.1 |
|---|---|
| Previous Daily High | 0.9140 |
| Previous Daily Low | 0.9059 |
| Previous Weekly High | 0.9280 |
| Previous Weekly Low | 0.9158 |
| Previous Monthly High | 0.9410 |
| Previous Monthly Low | 0.9085 |
| Daily Fibonacci 38.2% | 0.9109 |
| Daily Fibonacci 61.8% | 0.9090 |
| Daily Pivot Point S1 | 0.9083 |
| Daily Pivot Point S2 | 0.9031 |
| Daily Pivot Point S3 | 0.9003 |
| Daily Pivot Point R1 | 0.9163 |
| Daily Pivot Point R2 | 0.9191 |
| Daily Pivot Point R3 | 0.9243 |
[/s2If]
Join Our Telegram Group
")


