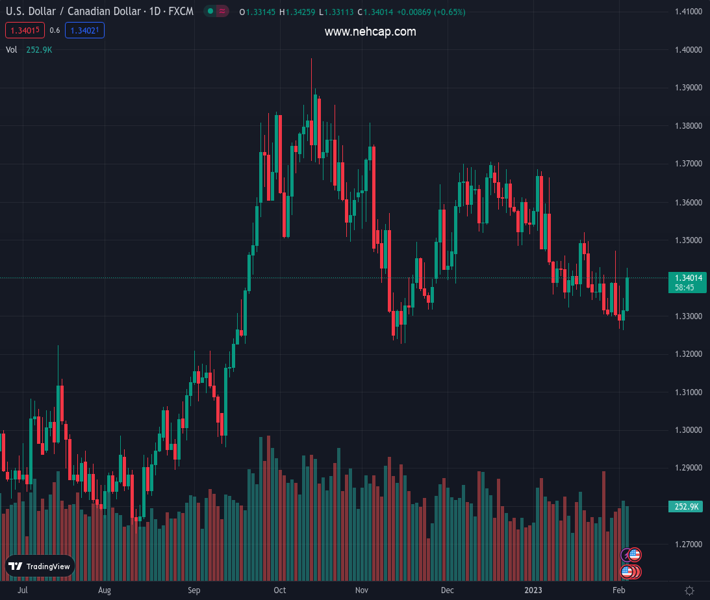
#USDCAD @ 1.34024 resumed its uptrend once it reclaimed the February 1 daily high at 1.3379. (Pivot Orderbook analysis)
…
This is a premium post.
[s2If !current_user_can(access_s2member_level4)]Please register for PREMIUM VERSION HERE to read full post below containing analysis. In case of any error or you think you are not able to read the full post below, please email us at support#nehcap.com [lwa][/s2If] [s2If current_user_can(access_s2member_level4)]
- USD/CAD resumed its uptrend once it reclaimed the February 1 daily high at 1.3379.
- USD/CAD Price Analysis: A daily close above 1.3400 will exacerbate a rally to 1.3500. otherwise, further downside is expected.
The pair currently trades last at 1.34024.
The previous day high was 1.3348 while the previous day low was 1.3262. The daily 38.2% Fib levels comes at 1.3315, expected to provide support. Similarly, the daily 61.8% fib level is at 1.3295, expected to provide support.
USD/CAD climbs in the North American session after hitting a daily low of 1.3311 before Wall Street opened. Nevertheless, a strong US jobs report bolstered the US Dollar, the strongest currency in the FX space. At the time of writing, the USD/CAD exchanges hand at 1.3402.
Technically speaking, the USD/CAD is still neutral-to-upward biased, though it reclaimed some resistance levels after testing the 200-day Exponential Moving Average (EMA) a couple of days ago. On its way north, the USD/CAD pair conquered an upslope-support trendline that was broken on January 31, which means the uptrend could resume shortly.
Therefore, the USD/CAD next resistance would be the 50-day EMA at 1.3443. Break above, and the USD/CAD pair would rally to January 31 daily high at 1.3471, followed by 1.3500.
As an alternate scenario, the USD/CAD first support would be the 1.3400 mark. Once cleared, the USD/CAD might test the 20-day EMA at 1.3388, followed by a downslope trendline turned support at 1.3355-65, and then the 1.3300 psychological barrier.
Technical Levels: Supports and Resistances
USDCAD currently trading at 1.34 at the time of writing. Pair opened at 1.3313 and is trading with a change of 0.65 % .
| Overview | Overview.1 | |
|---|---|---|
| 0 | Today last price | 1.3400 |
| 1 | Today Daily Change | 0.0087 |
| 2 | Today Daily Change % | 0.6500 |
| 3 | Today daily open | 1.3313 |
The pair is trading above its 20 Daily moving average @ 1.3383, below its 50 Daily moving average @ 1.3498 , below its 100 Daily moving average @ 1.3532 and above its 200 Daily moving average @ 1.3219
| Trends | Trends.1 | |
|---|---|---|
| 0 | Daily SMA20 | 1.3383 |
| 1 | Daily SMA50 | 1.3498 |
| 2 | Daily SMA100 | 1.3532 |
| 3 | Daily SMA200 | 1.3219 |
The previous day high was 1.3348 while the previous day low was 1.3262. The daily 38.2% Fib levels comes at 1.3315, expected to provide support. Similarly, the daily 61.8% fib level is at 1.3295, expected to provide support.
Note the levels of interest below:
- Pivot support is noted at 1.3268, 1.3222, 1.3183
- Pivot resistance is noted at 1.3353, 1.3393, 1.3438
| Levels | Levels.1 |
|---|---|
| Previous Daily High | 1.3348 |
| Previous Daily Low | 1.3262 |
| Previous Weekly High | 1.3428 |
| Previous Weekly Low | 1.3300 |
| Previous Monthly High | 1.3685 |
| Previous Monthly Low | 1.3300 |
| Daily Fibonacci 38.2% | 1.3315 |
| Daily Fibonacci 61.8% | 1.3295 |
| Daily Pivot Point S1 | 1.3268 |
| Daily Pivot Point S2 | 1.3222 |
| Daily Pivot Point S3 | 1.3183 |
| Daily Pivot Point R1 | 1.3353 |
| Daily Pivot Point R2 | 1.3393 |
| Daily Pivot Point R3 | 1.3438 |
[/s2If]
Join Our Telegram Group
")


