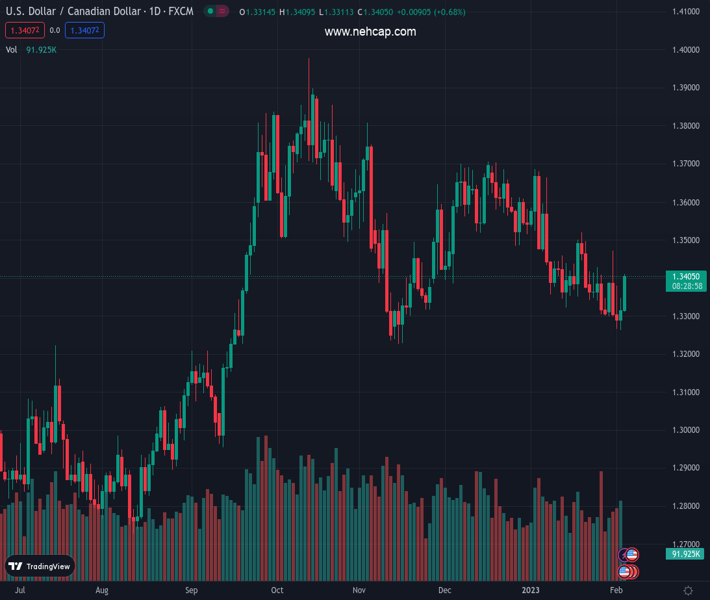
#USDCAD @ 1.33678 scales higher for the second straight day and builds on the overnight recovery. (Pivot Orderbook analysis)
…
This is a premium post.
[s2If !current_user_can(access_s2member_level4)]Please register for PREMIUM VERSION HERE to read full post below containing analysis. In case of any error or you think you are not able to read the full post below, please email us at support#nehcap.com [lwa][/s2If] [s2If current_user_can(access_s2member_level4)]
- USD/CAD scales higher for the second straight day and builds on the overnight recovery.
- Sliding US bond yields weighs on the USD and keeps a lid on any further gains for the pair.
- Investors now look forward to the closely-watched US monthly jobs data for some impetus.
The pair currently trades last at 1.33678.
The previous day high was 1.3348 while the previous day low was 1.3262. The daily 38.2% Fib levels comes at 1.3315, expected to provide support. Similarly, the daily 61.8% fib level is at 1.3295, expected to provide support.
The USD/CAD pair sticks to its strong intraday gains through the early North American session and is currently placed just above mid-1.3300s, still up over 0.30% for the day.
The overnight US Dollar rebound from a nine-month low run out of steam on the last day of the week amid a modest downtick in the US Treasury bond yields. This, in turn, is seen as a key factor acting as a tailwind for the USD/CAD pair. That said, a generally weaker tone around the equity markets limits the downside for the safe-haven buck and remains supportive of the bid tone surrounding the major.
Apart from this, expectations that robust employment could keep the US inflation higher and allow the Fed to stick to its hawkish stance for longer favours the USD bulls. In fact, an unexpected fall in the US Initial Jobless Claims on Thursday pointed to the underlying strength in the labor market. This might have raised hopes for a positive surprise from the closely-watched US monthly jobs data.
The popularly known NFP report is expected to show that the US economy added 185K jobs in January, down from 223K in the previous month. Moreover, the jobless rate is anticipated to edge higher to 3.6% from 3.5% in December. The data should drive the USD demand. This, along with oil price dynamics might influence the commodity-linked Loonie and provide some impetus to the USD/CAD pair.
Technical Levels: Supports and Resistances
USDCAD currently trading at 1.3363 at the time of writing. Pair opened at 1.3313 and is trading with a change of 0.38 % .
| Overview | Overview.1 | |
|---|---|---|
| 0 | Today last price | 1.3363 |
| 1 | Today Daily Change | 0.0050 |
| 2 | Today Daily Change % | 0.3800 |
| 3 | Today daily open | 1.3313 |
The pair is trading below its 20 Daily moving average @ 1.3383, below its 50 Daily moving average @ 1.3498 , below its 100 Daily moving average @ 1.3532 and above its 200 Daily moving average @ 1.3219
| Trends | Trends.1 | |
|---|---|---|
| 0 | Daily SMA20 | 1.3383 |
| 1 | Daily SMA50 | 1.3498 |
| 2 | Daily SMA100 | 1.3532 |
| 3 | Daily SMA200 | 1.3219 |
The previous day high was 1.3348 while the previous day low was 1.3262. The daily 38.2% Fib levels comes at 1.3315, expected to provide support. Similarly, the daily 61.8% fib level is at 1.3295, expected to provide support.
Note the levels of interest below:
- Pivot support is noted at 1.3268, 1.3222, 1.3183
- Pivot resistance is noted at 1.3353, 1.3393, 1.3438
| Levels | Levels.1 |
|---|---|
| Previous Daily High | 1.3348 |
| Previous Daily Low | 1.3262 |
| Previous Weekly High | 1.3428 |
| Previous Weekly Low | 1.3300 |
| Previous Monthly High | 1.3685 |
| Previous Monthly Low | 1.3300 |
| Daily Fibonacci 38.2% | 1.3315 |
| Daily Fibonacci 61.8% | 1.3295 |
| Daily Pivot Point S1 | 1.3268 |
| Daily Pivot Point S2 | 1.3222 |
| Daily Pivot Point S3 | 1.3183 |
| Daily Pivot Point R1 | 1.3353 |
| Daily Pivot Point R2 | 1.3393 |
| Daily Pivot Point R3 | 1.3438 |
[/s2If]
Join Our Telegram Group
")


