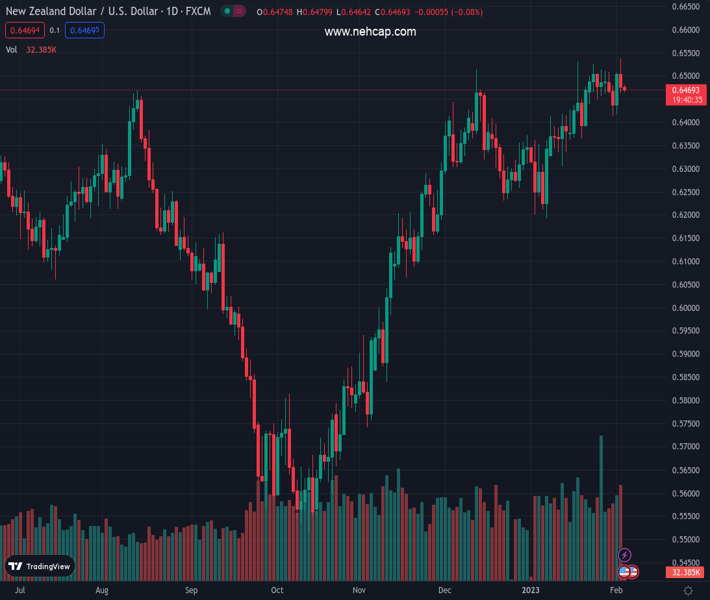
#NZDUSD @ 0.64680 is expected to display back-and-forth action ahead of the US NFP release. (Pivot Orderbook analysis)
…
This is a premium post.
[s2If !current_user_can(access_s2member_level4)]Please register for PREMIUM VERSION HERE to read full post below containing analysis. In case of any error or you think you are not able to read the full post below, please email us at support#nehcap.com [lwa][/s2If] [s2If current_user_can(access_s2member_level4)]
- NZD/USD is expected to display back-and-forth action ahead of the US NFP release.
- The Symmetrical Triangle formation is hinting a sheer volatility squeeze.
- A range shift by the RSI (14) into the 40.00-60.00 zone from the bullish range of 60.00-80.00 indicates a consolidation ahead.
The pair currently trades last at 0.64680.
The previous day high was 0.6538 while the previous day low was 0.6463. The daily 38.2% Fib levels comes at 0.6492, expected to provide resistance. Similarly, the daily 61.8% fib level is at 0.6509, expected to provide resistance.
The NZD/USD pair is demonstrating a sideways action below the immediate resistance of 0.6480 in the Asian session. The Kiwi asset has turned sideways as investors are awaiting the release of the Caixin Services PMI and United States Nonfarm Payrolls (NFP) data for fresh impetus.
Weak earnings have dented the three-day winning spell of the S&P500 futures, which are showing significant losses, portraying a risk aversion theme. The US Dollar Index (DXY) is looking to recapture Thursday’s high around 101.55 after a corrective move as investors’ risk appetite has faded significantly.
NZD/USD is auctioning in a Symmetrical Triangle chart pattern that indicates an extreme squeeze in volatility. The upward-sloping trendline of the chart pattern is placed from January 19 low at 0.6365 while the downward-sloping trendline is plotted from January 18 high at 0.6531. The Kiwi asset displayed a sheer fall on Thursday after failing to find buying strength post delivering a breakout, which resulted in a fakeout later and trapped investors at elevated levels.
The Relative Strength Index (RSI) (14) has shifted into the 40.00-60.00 range from the bullish range of 60.00-80.00, which indicates a consolidation ahead.
For the downside move, a breakdown below January 31 low at 0.6412 will drag the Kiwi asset toward January 17 low at 0.6366 followed by January 12 low around 0.6300.
On the flip side, the asset needs to surpass Thursday’s high at 0.6538 for resuming the upside move, which will drive the asset toward June 3 high at 0.6576. A breach of the latter will expose the asset to the round-level resistance at 0.6600.
Technical Levels: Supports and Resistances
NZDUSD currently trading at 0.6477 at the time of writing. Pair opened at 0.648 and is trading with a change of -0.05 % .
| Overview | Overview.1 | |
|---|---|---|
| 0 | Today last price | 0.6477 |
| 1 | Today Daily Change | -0.0003 |
| 2 | Today Daily Change % | -0.0500 |
| 3 | Today daily open | 0.6480 |
The pair remains strongly bullish on the daily timeframe. It trades above its 20 SMA @ 0.6436, 50 SMA 0.6369, 100 SMA @ 0.6103 and 200 SMA @ 0.6192.
| Trends | Trends.1 | |
|---|---|---|
| 0 | Daily SMA20 | 0.6436 |
| 1 | Daily SMA50 | 0.6369 |
| 2 | Daily SMA100 | 0.6103 |
| 3 | Daily SMA200 | 0.6192 |
The previous day high was 0.6538 while the previous day low was 0.6463. The daily 38.2% Fib levels comes at 0.6492, expected to provide resistance. Similarly, the daily 61.8% fib level is at 0.6509, expected to provide resistance.
Note the levels of interest below:
- Pivot support is noted at 0.6449, 0.6419, 0.6374
- Pivot resistance is noted at 0.6525, 0.6569, 0.66
| Levels | Levels.1 |
|---|---|
| Previous Daily High | 0.6538 |
| Previous Daily Low | 0.6463 |
| Previous Weekly High | 0.6526 |
| Previous Weekly Low | 0.6437 |
| Previous Monthly High | 0.6531 |
| Previous Monthly Low | 0.6190 |
| Daily Fibonacci 38.2% | 0.6492 |
| Daily Fibonacci 61.8% | 0.6509 |
| Daily Pivot Point S1 | 0.6449 |
| Daily Pivot Point S2 | 0.6419 |
| Daily Pivot Point S3 | 0.6374 |
| Daily Pivot Point R1 | 0.6525 |
| Daily Pivot Point R2 | 0.6569 |
| Daily Pivot Point R3 | 0.6600 |
[/s2If]
Join Our Telegram Group
")


