#GBPUSD @ 1.20560 The Pound Sterling opposes no resistance to upbeat economic data in the United States. (Pivot Orderbook analysis)
…
This is a premium post.
[s2If !current_user_can(access_s2member_level4)]Please register for PREMIUM VERSION HERE to read full post below containing analysis. In case of any error or you think you are not able to read the full post below, please email us at support#nehcap.com [lwa][/s2If] [s2If current_user_can(access_s2member_level4)]
- The Pound Sterling opposes no resistance to upbeat economic data in the United States.
- US jobs data and services activity showed that the US economy remains solid despite the US Federal Reserve tightening cycle.
- For the next week, GBP/USD traders are eyeing the UK GDP and US Fed speakers.
The pair currently trades last at 1.20560.
The previous day high was 1.2402 while the previous day low was 1.2229. The daily 38.2% Fib levels comes at 1.2295, expected to provide resistance. Similarly, the daily 61.8% fib level is at 1.2336, expected to provide resistance.
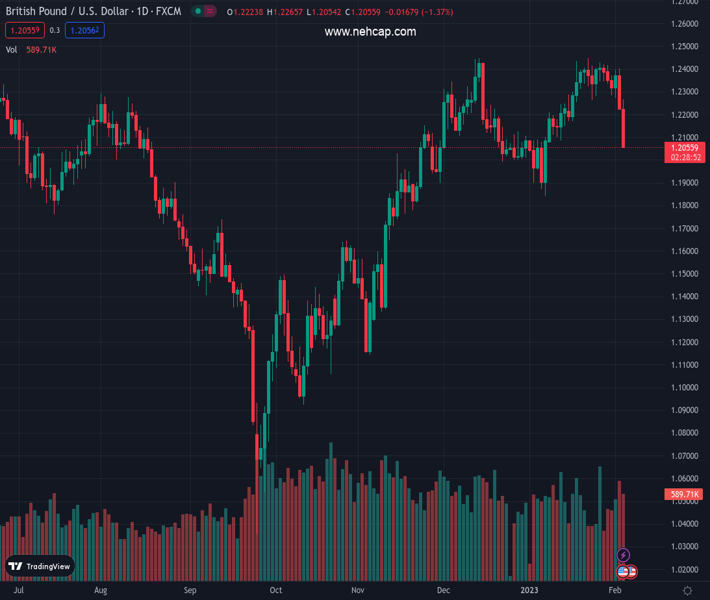
GBP/USD nosedives and extended its losses past the 50 and 200-day Exponential Moving Average (EMA) on Friday after a surprisingly strong jobs report from the United States (US) that increased speculations that the Federal Reserve (Fed) could raise rates back above Wednesday’s 25 basis points mark (bps). At the time of writing, the GBP/USD is trading at 1.2060 after reaching a daily high of 1.2265.
Investors’ sentiment turned sour after January’s Nonfarm Payrolls report was released. Data showed that the economy added 517K new jobs against the 200K estimated; consequently, the Unemployment Rate tumbled from 3.5% to 3.4%. Additionally, December’s data was revised upward, which means the US Federal Reserve still has ways to go to curb stubbornly high inflation towards the 2% goal.
As the headline crossed the screens, the GBP/USD dived from around its daily highs at 1.2260s and collapsed 200 pips towards the 1.2060 area. In the meantime, the US Dollar Index, a measure of the greenback’s value against a basket of six currencies, rose to a new three-week high at 102.90, up 0.94%.
Later, the Institute for Supply Management (ISM) revealed that services industry activity climbed above expansionary territory, boosted by new orders, while prices paid moderated. The ISM Non-Manufacturing PMI rose by 55.2 last month, vs. 49.2 in December and above the 50.4 foreseen by analysts.
Earlier in the European session, the UK S&P Global/CIPS Services PMI had its worst month in two years, falling to 48.7, down from December’s 49.9, its lowest level since January 2021. Therefore, the S&P Composite PMI, combining manufacturing and services data, slumped to 48.5 in January from 49.0 last month.
Next week’s UK economic calendar will feature the Monetary Policy Report Hearings and the Gross Domestic Product (GDP) MoM and QoQ. Across the pond, the US economic docket will feature the US Federal Reserve speakers, namely Jerome Powell and John C. Williams from the New York Fed. Additionally, Initial Jobless Claims and the University of Michigan (UoM) Consumer Sentiment would shed some light regarding the status of the US economy.
Technical Levels: Supports and Resistances
GBPUSD currently trading at 1.2061 at the time of writing. Pair opened at 1.2238 and is trading with a change of -1.45 % .
| Overview | Overview.1 | |
|---|---|---|
| 0 | Today last price | 1.2061 |
| 1 | Today Daily Change | -0.0177 |
| 2 | Today Daily Change % | -1.4500 |
| 3 | Today daily open | 1.2238 |
The pair is trading below its 20 Daily moving average @ 1.2291, below its 50 Daily moving average @ 1.2191 , above its 100 Daily moving average @ 1.1797 and above its 200 Daily moving average @ 1.1958
| Trends | Trends.1 | |
|---|---|---|
| 0 | Daily SMA20 | 1.2291 |
| 1 | Daily SMA50 | 1.2191 |
| 2 | Daily SMA100 | 1.1797 |
| 3 | Daily SMA200 | 1.1958 |
The previous day high was 1.2402 while the previous day low was 1.2229. The daily 38.2% Fib levels comes at 1.2295, expected to provide resistance. Similarly, the daily 61.8% fib level is at 1.2336, expected to provide resistance.
Note the levels of interest below:
- Pivot support is noted at 1.2178, 1.2117, 1.2005
- Pivot resistance is noted at 1.2351, 1.2463, 1.2524
| Levels | Levels.1 |
|---|---|
| Previous Daily High | 1.2402 |
| Previous Daily Low | 1.2229 |
| Previous Weekly High | 1.2448 |
| Previous Weekly Low | 1.2263 |
| Previous Monthly High | 1.2448 |
| Previous Monthly Low | 1.1841 |
| Daily Fibonacci 38.2% | 1.2295 |
| Daily Fibonacci 61.8% | 1.2336 |
| Daily Pivot Point S1 | 1.2178 |
| Daily Pivot Point S2 | 1.2117 |
| Daily Pivot Point S3 | 1.2005 |
| Daily Pivot Point R1 | 1.2351 |
| Daily Pivot Point R2 | 1.2463 |
| Daily Pivot Point R3 | 1.2524 |
[/s2If]
Join Our Telegram Group
")


