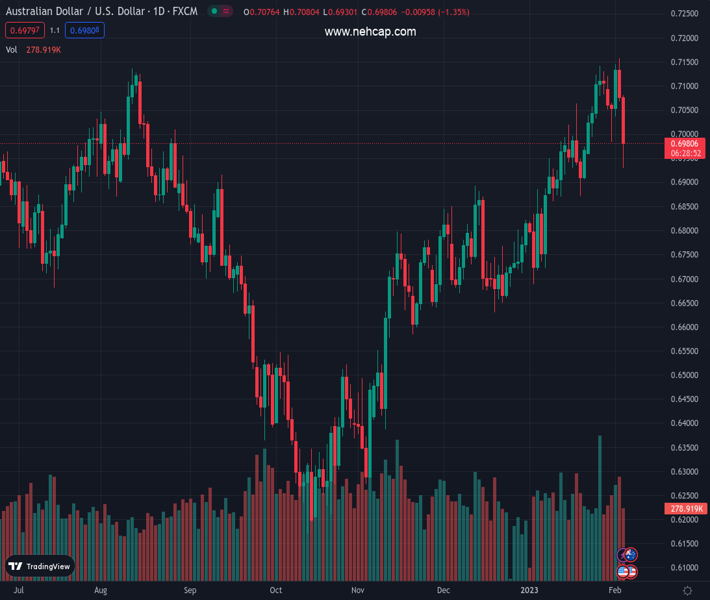
#AUDUSD @ 0.69791 falls sharply by more than 100 pips on US economic data. (Pivot Orderbook analysis)
…
This is a premium post.
[s2If !current_user_can(access_s2member_level4)]Please register for PREMIUM VERSION HERE to read full post below containing analysis. In case of any error or you think you are not able to read the full post below, please email us at support#nehcap.com [lwa][/s2If] [s2If current_user_can(access_s2member_level4)]
- AUD/USD falls sharply by more than 100 pips on US economic data.
- The US Nonfarm Payrolls report almost tripled the market’s expectations for job creation.
- US ISM Non-Manufacturing PMI is back at expansionary territory.
The pair currently trades last at 0.69791.
The previous day high was 0.7158 while the previous day low was 0.7069. The daily 38.2% Fib levels comes at 0.7103, expected to provide resistance. Similarly, the daily 61.8% fib level is at 0.7124, expected to provide resistance.
AUD/USD collapsed after US economic data revealed on Friday showed that the labor market remains tight, and it would keep the US Federal Reserve under pressure to bring down inflation to the 2% target. That, alongside the US Dollar paring WEdneadys losses on Thursday, are the reasons for today’s price action. At the time of writing, the AUD/USD exchanges hands at around 0.6970s.
Wall Street opened the last trading session of the week with losses. The US Department of Labor (DoL) revealed January’s data that surprised investors, with Nonfarm Payrolls data smashing expectations as the economy created 517K jobs in the economy, exceeding estimates for the creation of just 200K jobs. Consequently, the Unemployment Rate fell to 3.4% from 3.5%, while December’s figures were revised upward.
Average Hourly Earnings, sought by the US Federal Reserve as a measure of wages inflation, linked to last week’s Employment Cost Index (ECI), came at 0.3% MoM, in line with forecasts but lower than December’s report.
All that said, the AUD/USD extended its losses, but not without putting a fight around the 0.7000 psychological barrier. Once it gave way, the AUD/USD dropped below the 20-day Exponential Moving Average (EMA) at 0.6992 ad so far is eyeing the confluence of the January 19 daily low and the 50-day EMA at 0.6871.
In the bond market, US Treasury bond yields, mainly the 10-year benchmark note rate, climbed 14.5 bps to 3.54% after falling towards a monthly low of 3.334% on Thursday.
Of late, the US economic calendar revealed that S&P Global PMIs came slightly above estimates. Meanwhile, the ISM Non-Manufacturing PMI Index, which reports the behavior of the services economy, is back above in expansionary territory, rose to 55.2 from 50.4 estimates and way above December’s 49.2
Technical Levels: Supports and Resistances
AUDUSD currently trading at 0.696 at the time of writing. Pair opened at 0.7084 and is trading with a change of -1.75 % .
| Overview | Overview.1 | |
|---|---|---|
| 0 | Today last price | 0.6960 |
| 1 | Today Daily Change | -0.0124 |
| 2 | Today Daily Change % | -1.7500 |
| 3 | Today daily open | 0.7084 |
The pair is trading below its 20 Daily moving average @ 0.7001, above its 50 Daily moving average @ 0.6848 , above its 100 Daily moving average @ 0.6668 and above its 200 Daily moving average @ 0.6811
| Trends | Trends.1 | |
|---|---|---|
| 0 | Daily SMA20 | 0.7001 |
| 1 | Daily SMA50 | 0.6848 |
| 2 | Daily SMA100 | 0.6668 |
| 3 | Daily SMA200 | 0.6811 |
The previous day high was 0.7158 while the previous day low was 0.7069. The daily 38.2% Fib levels comes at 0.7103, expected to provide resistance. Similarly, the daily 61.8% fib level is at 0.7124, expected to provide resistance.
Note the levels of interest below:
- Pivot support is noted at 0.7049, 0.7014, 0.696
- Pivot resistance is noted at 0.7138, 0.7192, 0.7227
| Levels | Levels.1 |
|---|---|
| Previous Daily High | 0.7158 |
| Previous Daily Low | 0.7069 |
| Previous Weekly High | 0.7143 |
| Previous Weekly Low | 0.6960 |
| Previous Monthly High | 0.7143 |
| Previous Monthly Low | 0.6688 |
| Daily Fibonacci 38.2% | 0.7103 |
| Daily Fibonacci 61.8% | 0.7124 |
| Daily Pivot Point S1 | 0.7049 |
| Daily Pivot Point S2 | 0.7014 |
| Daily Pivot Point S3 | 0.6960 |
| Daily Pivot Point R1 | 0.7138 |
| Daily Pivot Point R2 | 0.7192 |
| Daily Pivot Point R3 | 0.7227 |
[/s2If]
Join Our Telegram Group
")


