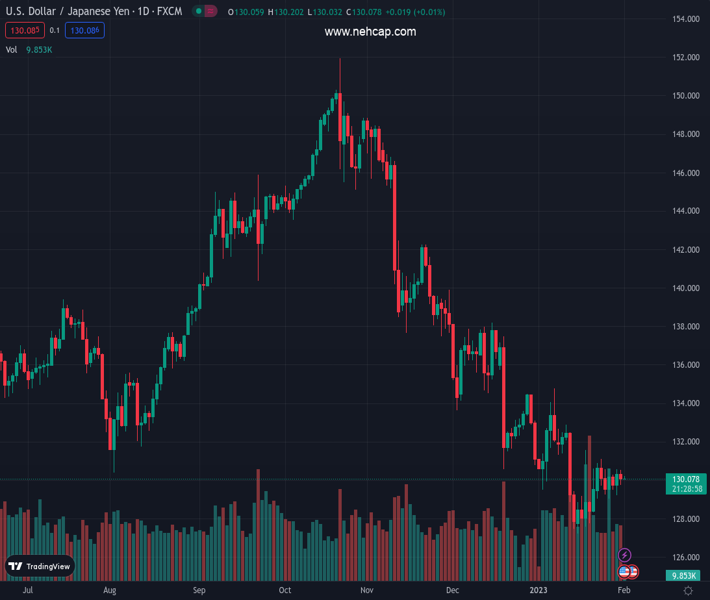
#USDJPY @ 130.085 picks up bids to pare recent losses but stays indecisive on a daily basis. (Pivot Orderbook analysis)
…
This is a premium post.
[s2If !current_user_can(access_s2member_level4)]Please register for PREMIUM VERSION HERE to read full post below containing analysis. In case of any error or you think you are not able to read the full post below, please email us at support#nehcap.com [lwa][/s2If] [s2If current_user_can(access_s2member_level4)]
- USD/JPY picks up bids to pare recent losses but stays indecisive on a daily basis.
- Downbeat US data, yields joined BoJ loans, fears of government intervention to favor Yen pair sellers.
- 10-year Japan Government Bond (JGB) yields keeps pushing BoJ to defend YCC policy.
- Fed Chair Powell’s press conference will be crucial as dovish hike already priced in.
The pair currently trades last at 130.085.
The previous day high was 130.53 while the previous day low was 129.74. The daily 38.2% Fib levels comes at 130.04, expected to provide support. Similarly, the daily 61.8% fib level is at 130.23, expected to provide resistance.
USD/JPY consolidates recent losses around 130.20, posting minor gains as market players appear cautious ahead of the key Federal Reserve (Fed) verdict. Also challenging the sentiment, as well as the Yen pair, could be the latest moves of the Japan Government Bond (JGB) yields.
The benchmark 10-year JGB yields keeps poking the Bank of Japan’s (BoJ) 0.50% limit during the seven-day uptrend. The same has recently pushed the Japanese central bank to intervene multiple times. On the same line were fears of government meddling which were raised by Hirohide Yamaguchi, one of the top candidates to become the next BoJ Governor.
On the other hand, the US 10-year Treasury bond yields snapped a three-day uptrend while revisiting 3.51% while the two-year counterpart also dropped to 4.20%, near the same levels by the press time.
It should be noted that downbeat US Treasury bond yields joined and firmer equity earnings and softer US data to renew the US Dollar weakness and strengthened the USD/JPY pullback.
That said, the US Dollar Index (DXY) printed the first daily loss in four on Tuesday, staying defensive near 102.00 by the press time.
Talking about the data, US Employment Cost Index (ECI) for the fourth quarter (Q4) eased to 1.0% versus 1.1% market forecasts and 1.2% prior readings. Further, the Conference Board (CB) Consumer Confidence eased to 107.10 in January versus 108.3 prior. It should be noted that no major attention could be given to the US Chicago Purchasing Managers’ Index (PMI) for January which rose to 44.3 versus 41 expected and 44.9 previous readings.
Elsewhere, earnings data from the industry majors like General Motors, Exxon and McDonalds pushed back recession woes and propelled the Wall Street benchmarks, which in turn weigh on the US Treasury bond yields and the DXY. That said, the Dow Jones Industrial Average (DJIA), S&P 500 and Nasdaq all three reported over 1.0% daily gains the previous day.
Looking ahead, multiple PMIs from China, Eurozone and the US may entertain the USD/JPY traders, as well as the JGB moves. However, major attention will be given to the Federal Reserve (Fed) meeting as the 0.25% rate hike is already priced-in while the policy pivot talks challenge the US Dollar bulls.
Also read: Federal Reserve Preview: The Good, the Bad and the Ugly, why the US Dollar would rise
A two-week-old symmetrical triangle restricts USD/JPY moves between 129.60 and 130.50.
Technical Levels: Supports and Resistances
USDJPY currently trading at 130.16 at the time of writing. Pair opened at 130.14 and is trading with a change of 0.02% % .
| Overview | Overview.1 | |
|---|---|---|
| 0 | Today last price | 130.16 |
| 1 | Today Daily Change | 0.02 |
| 2 | Today Daily Change % | 0.02% |
| 3 | Today daily open | 130.14 |
The pair remains strongly bearish on the daily time frame. It trades below the 20 SMA @ 130.33, 50 SMA 133.38, 100 SMA @ 139.19 and 200 SMA @ 136.79.
| Trends | Trends.1 | |
|---|---|---|
| 0 | Daily SMA20 | 130.33 |
| 1 | Daily SMA50 | 133.38 |
| 2 | Daily SMA100 | 139.19 |
| 3 | Daily SMA200 | 136.79 |
The previous day high was 130.53 while the previous day low was 129.74. The daily 38.2% Fib levels comes at 130.04, expected to provide support. Similarly, the daily 61.8% fib level is at 130.23, expected to provide resistance.
Note the levels of interest below:
- Pivot support is noted at 129.74, 129.35, 128.95
- Pivot resistance is noted at 130.53, 130.93, 131.32
| Levels | Levels.1 |
|---|---|
| Previous Daily High | 130.53 |
| Previous Daily Low | 129.74 |
| Previous Weekly High | 131.12 |
| Previous Weekly Low | 129.02 |
| Previous Monthly High | 134.78 |
| Previous Monthly Low | 127.22 |
| Daily Fibonacci 38.2% | 130.04 |
| Daily Fibonacci 61.8% | 130.23 |
| Daily Pivot Point S1 | 129.74 |
| Daily Pivot Point S2 | 129.35 |
| Daily Pivot Point S3 | 128.95 |
| Daily Pivot Point R1 | 130.53 |
| Daily Pivot Point R2 | 130.93 |
| Daily Pivot Point R3 | 131.32 |
[/s2If]
Join Our Telegram Group


