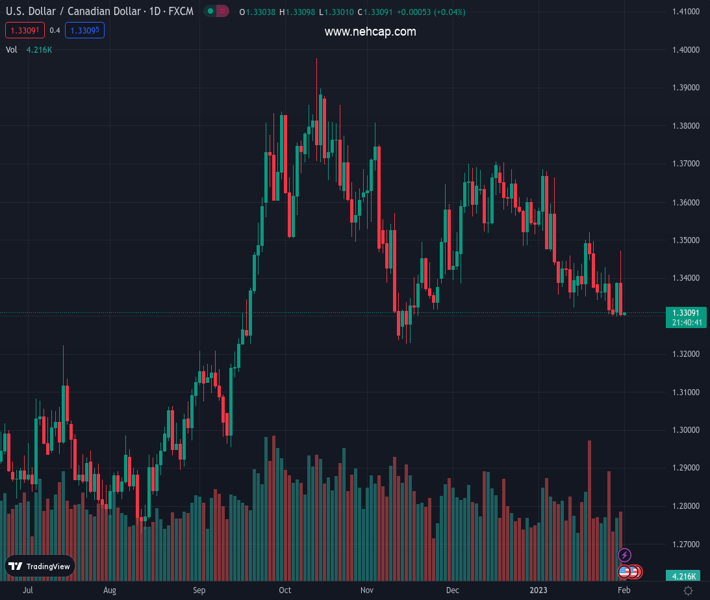
#USDCAD @ 1.33090 has turned sideways around 1.300 ahead of the interest rate decision by the Fed. (Pivot Orderbook analysis)
…
This is a premium post.
[s2If !current_user_can(access_s2member_level4)]Please register for PREMIUM VERSION HERE to read full post below containing analysis. In case of any error or you think you are not able to read the full post below, please email us at support#nehcap.com [lwa][/s2If] [s2If current_user_can(access_s2member_level4)]
- USD/CAD has turned sideways around 1.300 ahead of the interest rate decision by the Fed.
- The USD Index and Treasury yields dropped as the Fed is highly expected to announce a smaller interest rate hike.
- Oil prices recovered dramatically after upbeat China’s official PMI data.
The pair currently trades last at 1.33090.
The previous day high was 1.3389 while the previous day low was 1.33. The daily 38.2% Fib levels comes at 1.3355, expected to provide resistance. Similarly, the daily 61.8% fib level is at 1.3334, expected to provide resistance.
The USD/CAD pair is displaying a back-and-forth move around the immediate support of 1.3300 in the early Tokyo session. The Loonie asset witnessed an immense sell-off on Tuesday after a decline in the United States Employment Cost Index improved the risk appetite of the market participants. The US Dollar Index (DXY) sensed intensified selling as a decline in the labor cost index bolstered the expectations of a smaller interest rate hike by the Federal Reserve (Fed).
The USD Index dropped firmly below 101.70 after failing to sustain an auction above the 102.00 resistance. Meanwhile, S&P500 futures are showing some losses after a fantastic Tuesday, portraying a caution in the overall upbeat market mood. The 10-year US Treasury yields have dropped to near 3.51%.
The FX domain is going through sheer volatility as investors are awaiting the release of the interest rate decision by the Fed. Fed chair Jerome Powell is highly expected to hike interest rates by 25 basis points (bps) to the 4.50-4.75% range, therefore investors are much concerned about the further roadmap of achieving a 2% inflation target.
Analysts at TD Securities are of the view that The Federal Open Market Committee (FOMC) is likely to emphasize that despite slowing the pace of rate increases it is still determined to reach the terminal rate projected in the December dot plot.”
On the Loonie front, monthly Gross Domestic Product (GDP) (Nov) expanded by 0.1% while the street was expecting flat growth. A minor change in the GDP numbers might not force the Bank of Canada (BoC) to change its stance of remaining paused on interest rates. Last week, BoC Governor Tiff Macklem announced a pause in their interest rate hiking spell after pushing interest rates by 25 bps to 4.5%.
Meanwhile, oil prices recovered sharply on Tuesday after investors shrugged off uncertainty about global recession as the western central banks are set to announce fresh hikes to contain stubborn inflation. Also, upbeat China’s official PMI data-infused fresh blood into the oil price. It is worth noting that Canada is a leading exporter of oil to the United States and higher oil prices strengthen the Canadian Dollar.
Technical Levels: Supports and Resistances
USDCAD currently trading at 1.3306 at the time of writing. Pair opened at 1.3389 and is trading with a change of -0.62 % .
| Overview | Overview.1 | |
|---|---|---|
| 0 | Today last price | 1.3306 |
| 1 | Today Daily Change | -0.0083 |
| 2 | Today Daily Change % | -0.6200 |
| 3 | Today daily open | 1.3389 |
The pair is trading below its 20 Daily moving average @ 1.3424, below its 50 Daily moving average @ 1.3501 , below its 100 Daily moving average @ 1.3529 and above its 200 Daily moving average @ 1.3212
| Trends | Trends.1 | |
|---|---|---|
| 0 | Daily SMA20 | 1.3424 |
| 1 | Daily SMA50 | 1.3501 |
| 2 | Daily SMA100 | 1.3529 |
| 3 | Daily SMA200 | 1.3212 |
The previous day high was 1.3389 while the previous day low was 1.33. The daily 38.2% Fib levels comes at 1.3355, expected to provide resistance. Similarly, the daily 61.8% fib level is at 1.3334, expected to provide resistance.
Note the levels of interest below:
- Pivot support is noted at 1.333, 1.327, 1.324
- Pivot resistance is noted at 1.3419, 1.3449, 1.3509
| Levels | Levels.1 |
|---|---|
| Previous Daily High | 1.3389 |
| Previous Daily Low | 1.3300 |
| Previous Weekly High | 1.3428 |
| Previous Weekly Low | 1.3300 |
| Previous Monthly High | 1.3705 |
| Previous Monthly Low | 1.3385 |
| Daily Fibonacci 38.2% | 1.3355 |
| Daily Fibonacci 61.8% | 1.3334 |
| Daily Pivot Point S1 | 1.3330 |
| Daily Pivot Point S2 | 1.3270 |
| Daily Pivot Point S3 | 1.3240 |
| Daily Pivot Point R1 | 1.3419 |
| Daily Pivot Point R2 | 1.3449 |
| Daily Pivot Point R3 | 1.3509 |
[/s2If]
Join Our Telegram Group


