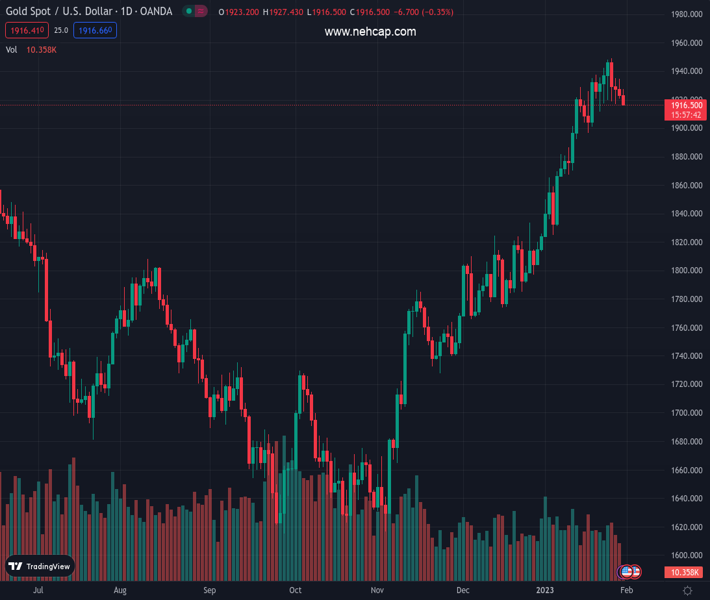
#XAUUSD @ 1,917.11 Gold price fades corrective bounce from intraday low during four-day downtrend., @nehcap view: Further downside expected (Pivot Orderbook analysis)
…
This is a premium post.
[s2If !current_user_can(access_s2member_level4)]Please register for PREMIUM VERSION HERE to read full post below containing analysis. In case of any error or you think you are not able to read the full post below, please email us at support#nehcap.com [lwa][/s2If] [s2If current_user_can(access_s2member_level4)]
- Gold price fades corrective bounce from intraday low during four-day downtrend.
- Risk profile appears unclear even as Covid news, China data join IMF’s hopes of economic revival.
- Cautious mood ahead of FOMC, sluggish yields and IMF’s fears of inflation seem to weigh on XAU/USD price.
The pair currently trades last at 1917.11.
The previous day high was 1934.54 while the previous day low was 1920.67. The daily 38.2% Fib levels comes at 1925.97, expected to provide resistance. Similarly, the daily 61.8% fib level is at 1929.24, expected to provide resistance.
Gold price (XAU/USD) holds lower grounds as sellers attack a short-term key support line near $1,920 heading into Tuesday’s European session. In doing so, the precious metal reverses the mid-Asian session’s corrective bounce off the stated trend line support.
The reason for the metal’s weakness could be linked to the mixed details of the International Monetary Fund (IMF) updates as the global lender cited inflation fears while showing hopes of economic recovery. On the same line could be the recent action from the Bank of Japan (BoJ) to defend the Yield Curve Control (YCC), which in turn puts a floor under the global yields and weigh on the Gold price.
Additionally, Monday’s upbeat US data and hopes that the Federal Reserve (Fed) will do anything to defend its hawkish monetary policy moves also seem to exert downside pressure on the XAU/USD price.
It’s worth noting that the likely end of the Covid-led activity restrictions in the US from May 11 and upbeat China PMIs previously triggered the XAU/USD rebound from the $1,920 support.
While portraying the mood, the US 10-year Treasury yields struggle to extend a three-day uptrend near 3.54% while the US Dollar Index (DXY) retreats to 102.20 at the latest. Further, the S&P 500 Futures remain mildly offered and so do stocks in the Asia-Pacific region.
Looking forward, the second-tier US data relating to sentiment and employment cost may entertain Gold traders but major attention will be given to the US Federal Reserve’s (Fed) monetary policy meeting.
Although a short-term ascending support line challenges the Gold sellers around $1,920, the metal’s retreat from the 200-Hour Moving Average (HMA) joins bearish MACD signals and downbeat RSI (14) to keep bears hopeful of conquering the $1,920 support.
Following that, the previous weekly low of around $1,911 may act as an intermediate halt before directing the Gold price toward the $1,900 round figure. It should be observed that the January 18 swing low near $1,896 adds to the downside filters.
Meanwhile, the 200-HMA and the 100-HMA restrict the short-term upside of the XAU/USD near $1,928 and $1,930 in that order.
Even if the Gold price remains firmer past $1,930, multiple hurdles near $1,935 and $1,943 could challenge the XAU/USD bulls.
Trend: Further downside expected
Technical Levels: Supports and Resistances
XAUUSD currently trading at 1920.57 at the time of writing. Pair opened at 1922.14 and is trading with a change of -0.08% % .
| Overview | Overview.1 | |
|---|---|---|
| 0 | Today last price | 1920.57 |
| 1 | Today Daily Change | -1.57 |
| 2 | Today Daily Change % | -0.08% |
| 3 | Today daily open | 1922.14 |
The pair remains strongly bullish on the daily timeframe. It trades above its 20 SMA @ 1901.06, 50 SMA 1832.91, 100 SMA @ 1757.26 and 200 SMA @ 1775.6.
| Trends | Trends.1 | |
|---|---|---|
| 0 | Daily SMA20 | 1901.06 |
| 1 | Daily SMA50 | 1832.91 |
| 2 | Daily SMA100 | 1757.26 |
| 3 | Daily SMA200 | 1775.60 |
The previous day high was 1934.54 while the previous day low was 1920.67. The daily 38.2% Fib levels comes at 1925.97, expected to provide resistance. Similarly, the daily 61.8% fib level is at 1929.24, expected to provide resistance.
Note the levels of interest below:
- Pivot support is noted at 1917.03, 1911.91, 1903.16
- Pivot resistance is noted at 1930.9, 1939.65, 1944.77
| Levels | Levels.1 |
|---|---|
| Previous Daily High | 1934.54 |
| Previous Daily Low | 1920.67 |
| Previous Weekly High | 1949.27 |
| Previous Weekly Low | 1911.45 |
| Previous Monthly High | 1833.38 |
| Previous Monthly Low | 1765.89 |
| Daily Fibonacci 38.2% | 1925.97 |
| Daily Fibonacci 61.8% | 1929.24 |
| Daily Pivot Point S1 | 1917.03 |
| Daily Pivot Point S2 | 1911.91 |
| Daily Pivot Point S3 | 1903.16 |
| Daily Pivot Point R1 | 1930.90 |
| Daily Pivot Point R2 | 1939.65 |
| Daily Pivot Point R3 | 1944.77 |
[/s2If]
Join Our Telegram Group
")


