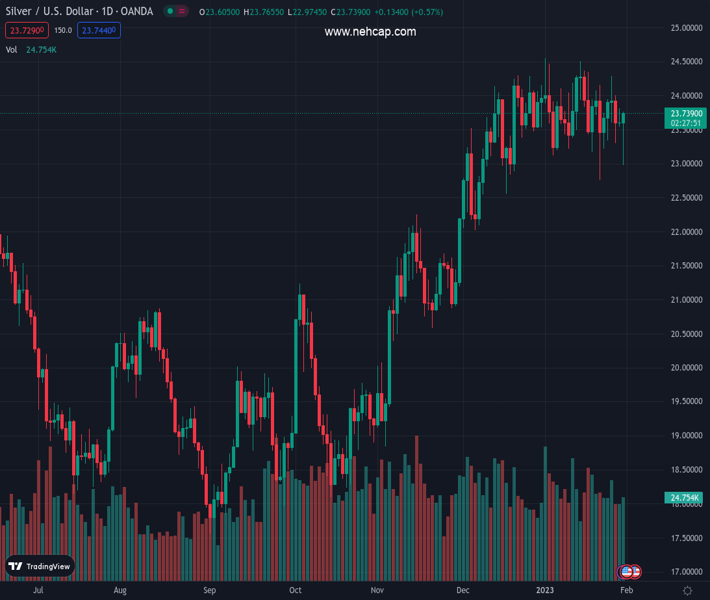
#XAGUSD @ 23.736 Silver is trapped within the 20 and 50-day Exponential Moving Averages, trendless. (Pivot Orderbook analysis)
…
This is a premium post.
[s2If !current_user_can(access_s2member_level4)]Please register for PREMIUM VERSION HERE to read full post below containing analysis. In case of any error or you think you are not able to read the full post below, please email us at support#nehcap.com [lwa][/s2If] [s2If current_user_can(access_s2member_level4)]
- Silver is trapped within the 20 and 50-day Exponential Moving Averages, trendless.
- Silver Price Analysis: Sideways but slightly tilted upwards, with buyers eyeing $25.00.
The pair currently trades last at 23.736.
The previous day high was 23.81 while the previous day low was 23.54. The daily 38.2% Fib levels comes at 23.65, expected to provide support. Similarly, the daily 61.8% fib level is at 23.71, expected to provide support.
Silver price extended its consolidation around the $23.00-$24.50 during the week, capped by the 20 and 50-day Exponential Moving Averages (EMAs), and remains unable to break the range decisively. However, XAG/USD erased some of its earlier losses and shifted positively in the day, trading at $23.71, gaining 0.53%.
XAG/USD’s price action has remained sideways for almost a month, around the $23.00-$24.50 range, in the near term. The lack of a catalyst keeps the white metal at around a peak, though it’s too early to call it like that, with the US Federal Reserve’s decision on Wednesday. At the time of typing, the XAG/USD hovers around the 20-day EMA at $23.69, which has been used as a pivot in the last 19, with the price fluctuating around it.
As the XAG/USD continues to rally in the session, a break above the 20-day EMA could pave the way for further upside, being the psychological $24.00 figure, the first supply area. Once cleared, the XAG/USD would be poised to challenge the YTD high at $24.54, followed by the $25.00 mark.
On the flip side, XAG/USD’s fall below the 50-day EMA at $23.10, and Silver will soon test the $23.00 mark. A breach of the latter will send Silver slumping to the YTD low at $22.76, followed by the 100-day EMA at $22.24 and then the 200-day EMA at $21.90.
Technical Levels: Supports and Resistances
XAGUSD currently trading at 23.72 at the time of writing. Pair opened at 23.57 and is trading with a change of 0.64 % .
| Overview | Overview.1 | |
|---|---|---|
| 0 | Today last price | 23.72 |
| 1 | Today Daily Change | 0.15 |
| 2 | Today Daily Change % | 0.64 |
| 3 | Today daily open | 23.57 |
The pair is trading below its 20 Daily moving average @ 23.75, above its 50 Daily moving average @ 23.26 , above its 100 Daily moving average @ 21.53 and above its 200 Daily moving average @ 21.01
| Trends | Trends.1 | |
|---|---|---|
| 0 | Daily SMA20 | 23.75 |
| 1 | Daily SMA50 | 23.26 |
| 2 | Daily SMA100 | 21.53 |
| 3 | Daily SMA200 | 21.01 |
The previous day high was 23.81 while the previous day low was 23.54. The daily 38.2% Fib levels comes at 23.65, expected to provide support. Similarly, the daily 61.8% fib level is at 23.71, expected to provide support.
Note the levels of interest below:
- Pivot support is noted at 23.48, 23.38, 23.21
- Pivot resistance is noted at 23.74, 23.91, 24.0
| Levels | Levels.1 |
|---|---|
| Previous Daily High | 23.81 |
| Previous Daily Low | 23.54 |
| Previous Weekly High | 24.30 |
| Previous Weekly Low | 22.76 |
| Previous Monthly High | 24.30 |
| Previous Monthly Low | 22.03 |
| Daily Fibonacci 38.2% | 23.65 |
| Daily Fibonacci 61.8% | 23.71 |
| Daily Pivot Point S1 | 23.48 |
| Daily Pivot Point S2 | 23.38 |
| Daily Pivot Point S3 | 23.21 |
| Daily Pivot Point R1 | 23.74 |
| Daily Pivot Point R2 | 23.91 |
| Daily Pivot Point R3 | 24.00 |
[/s2If]
Join Our Telegram Group
")


