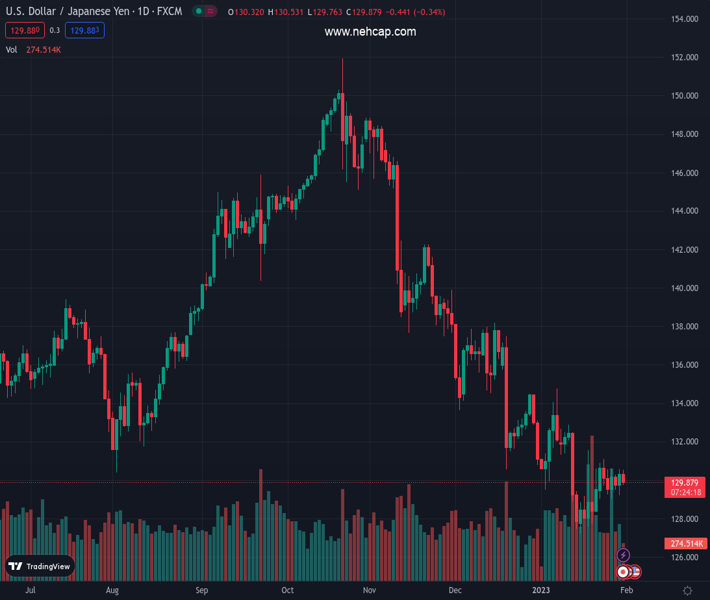
#USDJPY @ 129.789 remains capped near a two-week-old descending trend-line hurdle. (Pivot Orderbook analysis)
…
This is a premium post.
[s2If !current_user_can(access_s2member_level4)]Please register for PREMIUM VERSION HERE to read full post below containing analysis. In case of any error or you think you are not able to read the full post below, please email us at support#nehcap.com [lwa][/s2If] [s2If current_user_can(access_s2member_level4)]
- USD/JPY remains capped near a two-week-old descending trend-line hurdle.
- The formation of a bearish pennant supports prospects for a fresh leg down.
- A sustained move beyond mid-130.00s is needed to negate the bearish outlook.
The pair currently trades last at 129.789.
The previous day high was 130.57 while the previous day low was 129.21. The daily 38.2% Fib levels comes at 130.05, expected to provide resistance. Similarly, the daily 61.8% fib level is at 129.73, expected to provide support.
The USD/JPY pair struggles to capitalize on the previous day’s rally of over 135 pips from the 129.20 area and oscillates in a narrow range through the early North American session on Tuesday.
From a technical perspective, a descending trend-line extending from January 18, currently around the 130.50 area, caps the upside for the USD/JPY pair. This, along with another upward-sloping trend line, constitutes the formation of a symmetrical triangle and points to a consolidation phase.
Given the recent sharp decline from over a three-decade high, the aforementioned triangle might now be categorized as a bearish pennant. This, in turn, favours bearish traders and supports prospects for the resumption of the well-established declining trend witnessed over the past three months or so.
That said, it will still be prudent to wait for a convincing break below the triangle support, 129.25 region, before placing fresh bearish bets. The USD/JPY pair might then turn vulnerable to weaken below the 129.00 mark and test intermediate support near the 128.75-128.70 horizontal zone.
The downward trajectory could get extended further towards the 128.00 round-figure mark, below which the USD/JPY pair seems all set to challenge the multi-month low, around the 127.20 zone touched on January 16.
That said, a sustained strength beyond mid-130.00s, or the top end of the symmetrical triangle, will negate the negative outlook and prompt some near-term short-covering rally. The USD/JPY pair might then accelerate the momentum towards the 131.00 mark, en route to the post-BoJ swing high, around the 131.55-131.60 area. Some follow-through buying should pave the way for additional near-term gains.
Technical Levels: Supports and Resistances
USDJPY currently trading at 130.14 at the time of writing. Pair opened at 130.46 and is trading with a change of -0.25 % .
| Overview | Overview.1 | |
|---|---|---|
| 0 | Today last price | 130.14 |
| 1 | Today Daily Change | -0.32 |
| 2 | Today Daily Change % | -0.25 |
| 3 | Today daily open | 130.46 |
The pair remains strongly bearish on the daily time frame. It trades below the 20 SMA @ 130.37, 50 SMA 133.6, 100 SMA @ 139.34 and 200 SMA @ 136.77.
| Trends | Trends.1 | |
|---|---|---|
| 0 | Daily SMA20 | 130.37 |
| 1 | Daily SMA50 | 133.60 |
| 2 | Daily SMA100 | 139.34 |
| 3 | Daily SMA200 | 136.77 |
The previous day high was 130.57 while the previous day low was 129.21. The daily 38.2% Fib levels comes at 130.05, expected to provide resistance. Similarly, the daily 61.8% fib level is at 129.73, expected to provide support.
Note the levels of interest below:
- Pivot support is noted at 129.59, 128.72, 128.23
- Pivot resistance is noted at 130.95, 131.44, 132.32
| Levels | Levels.1 |
|---|---|
| Previous Daily High | 130.57 |
| Previous Daily Low | 129.21 |
| Previous Weekly High | 131.12 |
| Previous Weekly Low | 129.02 |
| Previous Monthly High | 138.18 |
| Previous Monthly Low | 130.57 |
| Daily Fibonacci 38.2% | 130.05 |
| Daily Fibonacci 61.8% | 129.73 |
| Daily Pivot Point S1 | 129.59 |
| Daily Pivot Point S2 | 128.72 |
| Daily Pivot Point S3 | 128.23 |
| Daily Pivot Point R1 | 130.95 |
| Daily Pivot Point R2 | 131.44 |
| Daily Pivot Point R3 | 132.32 |
[/s2If]
Join Our Telegram Group
")


