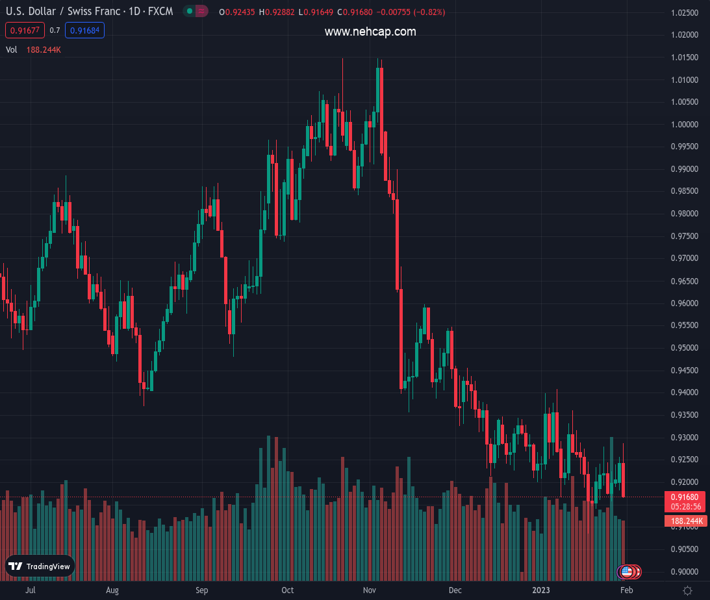
#USDCHF @ 0.91676 dips below 0.9200 as the US Dollar weakens and tumbles below the 20-day EMA. (Pivot Orderbook analysis)
…
This is a premium post.
[s2If !current_user_can(access_s2member_level4)]Please register for PREMIUM VERSION HERE to read full post below containing analysis. In case of any error or you think you are not able to read the full post below, please email us at support#nehcap.com [lwa][/s2If] [s2If current_user_can(access_s2member_level4)]
- USD/CHF dips below 0.9200 as the US Dollar weakens and tumbles below the 20-day EMA.
- USD/CHF Price Analysis: Downward biased and might test the YTD low if it slides below 0.9100.
The pair currently trades last at 0.91676.
The previous day high was 0.9257 while the previous day low was 0.9182. The daily 38.2% Fib levels comes at 0.9228, expected to provide resistance. Similarly, the daily 61.8% fib level is at 0.9211, expected to provide resistance.
The USD/CHF stumbles sharply after hitting a two-week new high at 0.9288 and drops beneath 0.9200, to fresh two-day lows around 0.9174, before settling at around the current exchange rate. The USD/CHF changes hands at 0.9173, below its opening price by 0.75%.
During Tuesday’s session, the USD/CHF was quickly rejected, slightly above the January 24 daily high of 0.9279, with bears stepping in aggressively, sending the USD/CHF sliding firstly towards the 0.9200 figure, followed by a dip towards the 0.9180 area.
On its way downward, the USD/CHF pair cleared the 20-day Exponential Moving Average (EMA) at 0.9230 and also was seen back below downslope resistance trendlines, drawn since November and January. Therefore, the USD/CHF is downward biased in the short term and might test crucial demand levels.
The USD/CHF first support would be the January 26 high at 0.9158. The break below will expose the 0.9100 psychological level, followed by the YTD low at 0.9085.
As an alternate scenario, the USD/CHF reclaiming the 0.9200 figure, that would open the door for further gains. The next ceiling level would be the 20-day EMA at 0.9230, followed by the January 31 high at 0.9288
Technical Levels: Supports and Resistances
USDCHF currently trading at 0.918 at the time of writing. Pair opened at 0.9253 and is trading with a change of -0.79 % .
| Overview | Overview.1 | |
|---|---|---|
| 0 | Today last price | 0.9180 |
| 1 | Today Daily Change | -0.0073 |
| 2 | Today Daily Change % | -0.7900 |
| 3 | Today daily open | 0.9253 |
The pair remains strongly bearish on the daily time frame. It trades below the 20 SMA @ 0.9245, 50 SMA 0.9312, 100 SMA @ 0.9567 and 200 SMA @ 0.963.
| Trends | Trends.1 | |
|---|---|---|
| 0 | Daily SMA20 | 0.9245 |
| 1 | Daily SMA50 | 0.9312 |
| 2 | Daily SMA100 | 0.9567 |
| 3 | Daily SMA200 | 0.9630 |
The previous day high was 0.9257 while the previous day low was 0.9182. The daily 38.2% Fib levels comes at 0.9228, expected to provide resistance. Similarly, the daily 61.8% fib level is at 0.9211, expected to provide resistance.
Note the levels of interest below:
- Pivot support is noted at 0.9205, 0.9156, 0.913
- Pivot resistance is noted at 0.9279, 0.9305, 0.9354
| Levels | Levels.1 |
|---|---|
| Previous Daily High | 0.9257 |
| Previous Daily Low | 0.9182 |
| Previous Weekly High | 0.9280 |
| Previous Weekly Low | 0.9158 |
| Previous Monthly High | 0.9471 |
| Previous Monthly Low | 0.9201 |
| Daily Fibonacci 38.2% | 0.9228 |
| Daily Fibonacci 61.8% | 0.9211 |
| Daily Pivot Point S1 | 0.9205 |
| Daily Pivot Point S2 | 0.9156 |
| Daily Pivot Point S3 | 0.9130 |
| Daily Pivot Point R1 | 0.9279 |
| Daily Pivot Point R2 | 0.9305 |
| Daily Pivot Point R3 | 0.9354 |
[/s2If]
Join Our Telegram Group
")


