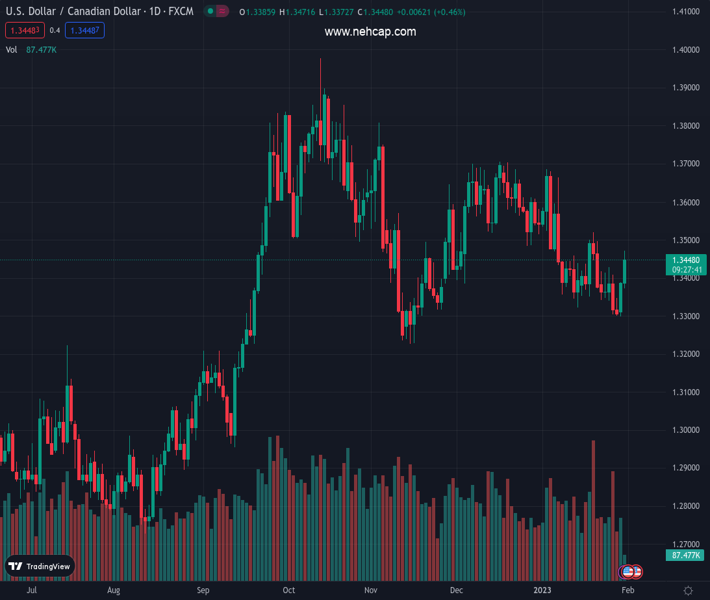
#USDCAD @ 1.34495 gains strong follow-through traction for the second successive day on Tuesday. (Pivot Orderbook analysis)
…
This is a premium post.
[s2If !current_user_can(access_s2member_level4)]Please register for PREMIUM VERSION HERE to read full post below containing analysis. In case of any error or you think you are not able to read the full post below, please email us at support#nehcap.com [lwa][/s2If] [s2If current_user_can(access_s2member_level4)]
- USD/CAD gains strong follow-through traction for the second successive day on Tuesday.
- Sliding crude oil prices undermines the Loonie and acts as a tailwind amid a stronger USD.
- Technical buying above the 1.3400 mark further contributes to the strong intraday rally.
The pair currently trades last at 1.34495.
The previous day high was 1.3389 while the previous day low was 1.33. The daily 38.2% Fib levels comes at 1.3355, expected to provide support. Similarly, the daily 61.8% fib level is at 1.3334, expected to provide support.
The USD/CAD pair builds on the previous day’s solid bounce from the 1.3300 mark, or a nearly two-week low and gains strong follow-through traction for the second successive day on Tuesday. The momentum remains uninterrupted and lifts spot prices to a one-and-half-week high, around the 1.3470 region heading into the North American session.
Crude oil prices prolong last week’s rejection slide from the 100-day SMA for the third straight day, which, in turn, undermines the commodity-linked Loonie and acts as a tailwind for the USD/CAD pair. In fact, the black liquid drops to a nearly three-week low amid fears of a near-term supply glut, led by data indicating a rise in crude exports from Russia’s Baltic ports in early February.
Apart from this, the worst COVID-19 outbreak in China raises uncertainty about strong economic growth in the country. This, to a larger extent, overshadows the optimism about a fuel demand recovery in the world’s top importer. Furthermore, expectations that OPEC+ will likely keep output unchanged during a meeting on Wednesday exert downward pressure on crude oil prices.
This, along with a modest US Dollar strength, turns out to be another factor providing an additional boost to the USD/CAD pair. The prevalent cautious mood – as depicted by a generally weaker tone around the equity markets – is seen driving some haven flows towards the greenback. The USD uptick could also be attributed to some repositioning trade ahead of the key central bank event risk.
The Fed will announce its policy decision at the end of a two-day meeting on Wednesday and is expected to deliver a smaller 25 bps rate hike. The recent US macro data, however, point to an economy that is resilient despite the rapidly rising borrowing costs and backs the case for the Fed to stick to its hawkish stance for longer. This prompts traders to lighten their USD bearish bets.
The strong intraday move up, meanwhile, pushes the USD/CAD pair through the 1.3400-1.3410 resistance zone, triggering a fresh bout of a short-covering and supporting prospects for additional gains. Traders now look to Tuesday’s economic docket, featuring the monthly Canadian GDP print, along with Chicago PMI and the Conference Board Consumer Confidence Index from the US.
Technical Levels: Supports and Resistances
USDCAD currently trading at 1.3454 at the time of writing. Pair opened at 1.3389 and is trading with a change of 0.49 % .
| Overview | Overview.1 | |
|---|---|---|
| 0 | Today last price | 1.3454 |
| 1 | Today Daily Change | 0.0065 |
| 2 | Today Daily Change % | 0.4900 |
| 3 | Today daily open | 1.3389 |
The pair is trading above its 20 Daily moving average @ 1.3424, below its 50 Daily moving average @ 1.3501 , below its 100 Daily moving average @ 1.3529 and above its 200 Daily moving average @ 1.3212
| Trends | Trends.1 | |
|---|---|---|
| 0 | Daily SMA20 | 1.3424 |
| 1 | Daily SMA50 | 1.3501 |
| 2 | Daily SMA100 | 1.3529 |
| 3 | Daily SMA200 | 1.3212 |
The previous day high was 1.3389 while the previous day low was 1.33. The daily 38.2% Fib levels comes at 1.3355, expected to provide support. Similarly, the daily 61.8% fib level is at 1.3334, expected to provide support.
Note the levels of interest below:
- Pivot support is noted at 1.333, 1.327, 1.324
- Pivot resistance is noted at 1.3419, 1.3449, 1.3509
| Levels | Levels.1 |
|---|---|
| Previous Daily High | 1.3389 |
| Previous Daily Low | 1.3300 |
| Previous Weekly High | 1.3428 |
| Previous Weekly Low | 1.3300 |
| Previous Monthly High | 1.3705 |
| Previous Monthly Low | 1.3385 |
| Daily Fibonacci 38.2% | 1.3355 |
| Daily Fibonacci 61.8% | 1.3334 |
| Daily Pivot Point S1 | 1.3330 |
| Daily Pivot Point S2 | 1.3270 |
| Daily Pivot Point S3 | 1.3240 |
| Daily Pivot Point R1 | 1.3419 |
| Daily Pivot Point R2 | 1.3449 |
| Daily Pivot Point R3 | 1.3509 |
[/s2If]
Join Our Telegram Group
")


