#USDCAD @ 1.34111 picks up bids to refresh intraday high, extends bounce off 1.5-month low., @nehcap view: Further upside expected (Pivot Orderbook analysis)
…
This is a premium post.
[s2If !current_user_can(access_s2member_level4)]Please register for PREMIUM VERSION HERE to read full post below containing analysis. In case of any error or you think you are not able to read the full post below, please email us at support#nehcap.com [lwa][/s2If] [s2If current_user_can(access_s2member_level4)]
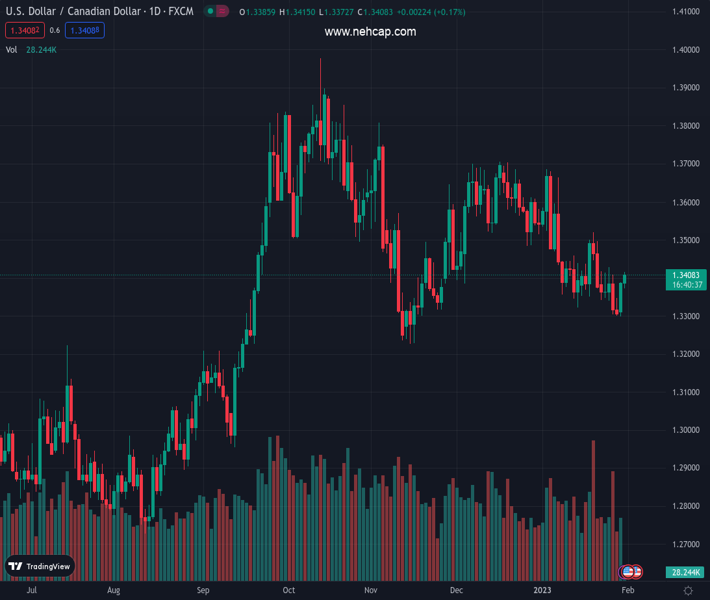
- USD/CAD picks up bids to refresh intraday high, extends bounce off 1.5-month low.
- Firmer RSI, looming bull cross on MACD keep buyers hopeful.
- 100-DMA appears crucial hurdle for the bulls to cross.
- Pullback remains elusive unless the quote stays beyond 1.3300.
The pair currently trades last at 1.34111.
The previous day high was 1.3389 while the previous day low was 1.33. The daily 38.2% Fib levels comes at 1.3355, expected to provide support. Similarly, the daily 61.8% fib level is at 1.3334, expected to provide support.
USD/CAD holds onto the week-start recovery from a six-week low as it crosses the monthly resistance line during early Tuesday, refreshing intraday high around 1.3415 by the press time.
In doing so, the Loonie pair justifies the rebound from the 1.3300 round figure, as well as the recovery in the RSI (14) line. With this, the MACD also teases buyers and adds strength to the upside bias.
However, the 21-DMA hurdle surrounding 1.3425 holds the key for the USD/CAD pair’s further upside towards the 1.3500 round figure.
In a case where the Loonie pair remains firmer past 1.3500, the January 19 swing high near 1.3520 and the 100-DMA hurdle surrounding 1.3530 could probe the bulls before directing them to the monthly high of 1.3680.
It’s worth noting that the 61.8% Fibonacci retracement level of the USD/CAD pair’s October-November downside, near 1.3690, precedes the 1.3700 round figure to act as the last defense of the bears.
On the contrary, a daily closing below the stated resistance line, close to 1.3400 by the press time, could renew the downside move targeting the latest swing low near 1.3300.
However, any further weakness in the USD/CAD price won’t hesitate to challenge the late 2022 bottom near 1.3225.
Trend: Further upside expected
Technical Levels: Supports and Resistances
USDCAD currently trading at 1.3414 at the time of writing. Pair opened at 1.3389 and is trading with a change of 0.19% % .
| Overview | Overview.1 | |
|---|---|---|
| 0 | Today last price | 1.3414 |
| 1 | Today Daily Change | 0.0025 |
| 2 | Today Daily Change % | 0.19% |
| 3 | Today daily open | 1.3389 |
The pair is trading below its 20 Daily moving average @ 1.3424, below its 50 Daily moving average @ 1.3501 , below its 100 Daily moving average @ 1.3529 and above its 200 Daily moving average @ 1.3212
| Trends | Trends.1 | |
|---|---|---|
| 0 | Daily SMA20 | 1.3424 |
| 1 | Daily SMA50 | 1.3501 |
| 2 | Daily SMA100 | 1.3529 |
| 3 | Daily SMA200 | 1.3212 |
The previous day high was 1.3389 while the previous day low was 1.33. The daily 38.2% Fib levels comes at 1.3355, expected to provide support. Similarly, the daily 61.8% fib level is at 1.3334, expected to provide support.
Note the levels of interest below:
- Pivot support is noted at 1.333, 1.327, 1.324
- Pivot resistance is noted at 1.3419, 1.3449, 1.3509
| Levels | Levels.1 |
|---|---|
| Previous Daily High | 1.3389 |
| Previous Daily Low | 1.3300 |
| Previous Weekly High | 1.3428 |
| Previous Weekly Low | 1.3300 |
| Previous Monthly High | 1.3705 |
| Previous Monthly Low | 1.3385 |
| Daily Fibonacci 38.2% | 1.3355 |
| Daily Fibonacci 61.8% | 1.3334 |
| Daily Pivot Point S1 | 1.3330 |
| Daily Pivot Point S2 | 1.3270 |
| Daily Pivot Point S3 | 1.3240 |
| Daily Pivot Point R1 | 1.3419 |
| Daily Pivot Point R2 | 1.3449 |
| Daily Pivot Point R3 | 1.3509 |
[/s2If]
Join Our Telegram Group
")


